Navigating the InfoWater Pro interface
Step-by-step guide
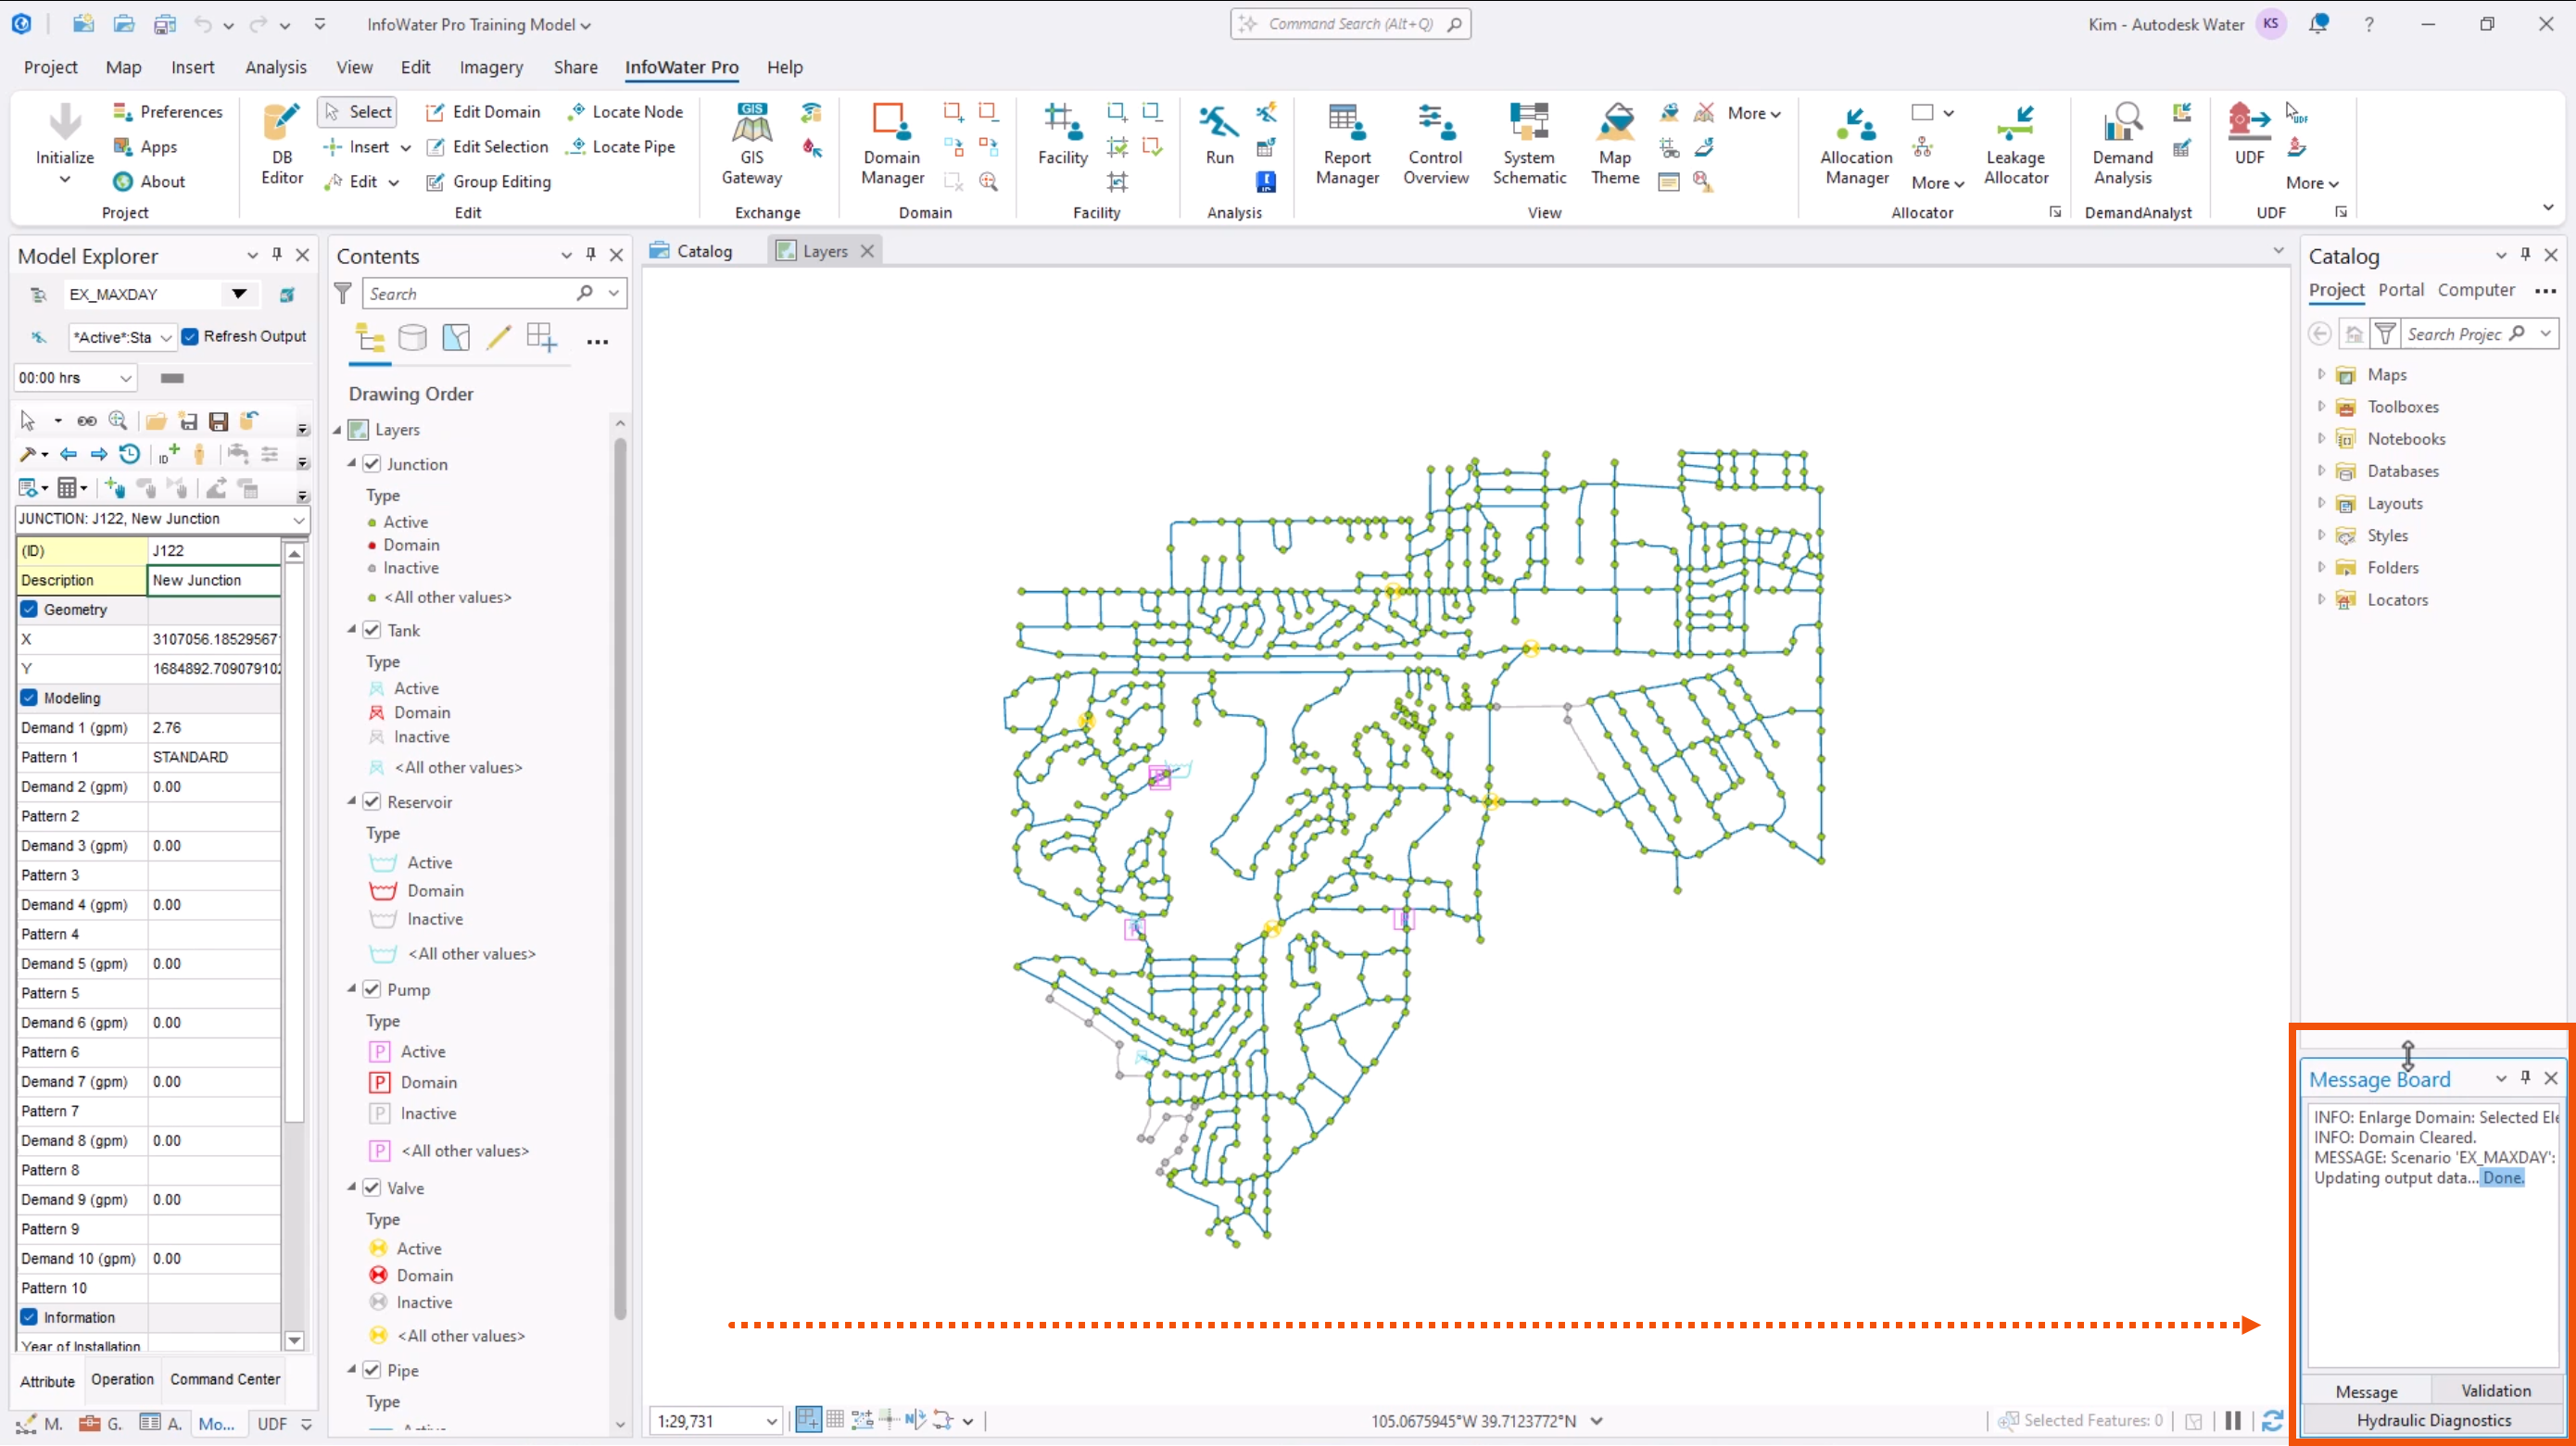
The ArcGIS Pro interface uses a traditional ribbon interface with common tools arranged in tabbed groupings across the top. Below the ribbon, various panels are displayed for working with maps, scenes, layouts, tables, charts, the catalog, and other representations of your data. Several panels can be open at the same time.
All ArcGIS Pro functions and tools are accessible when working with InfoWater Pro. Specific InfoWater Pro menus and tools are found in a tab within the ArcGIS Pro ribbon. This tab contains all commonly used InfoWater Pro commands, grouped by modeling purposes. When first accessed, most of these commands are greyed out until an InfoWater Pro project is initialized.
The InfoWater Pro ribbon contains several groups of commands.
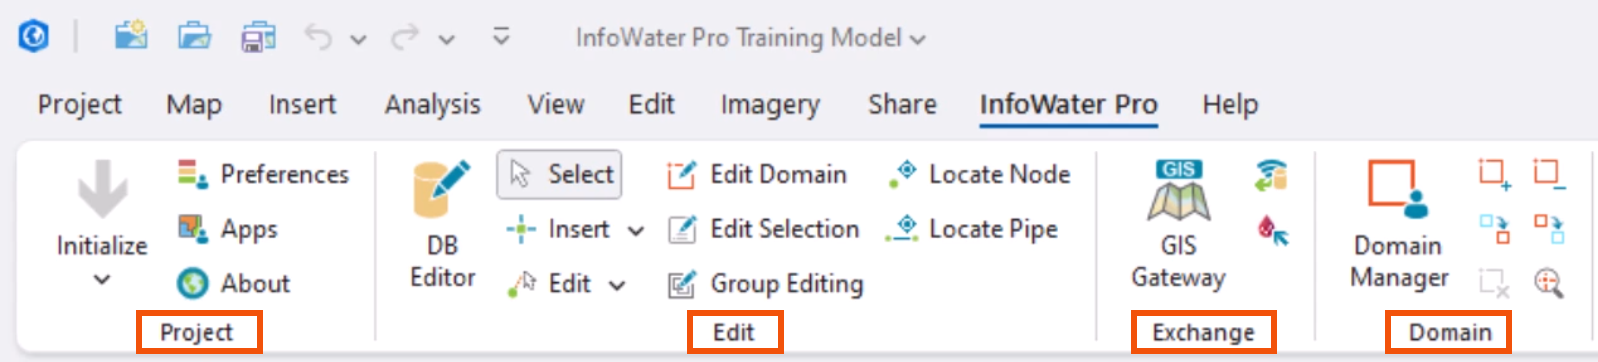
- The Project group contains the commands that control how ArcGIS Pro and InfoWater Pro interact.
- The Edit group has tools for working with InfoWater Pro project elements.
- The Exchange group is for data exchange, which includes importing and exporting, connecting to live sensor data, and uploading data to Info360.
- The Domain group is for working with domains. A domain is a selection of elements, created either manually or through data queries. Use these tools to create, edit, and add to or remove elements from the domain.
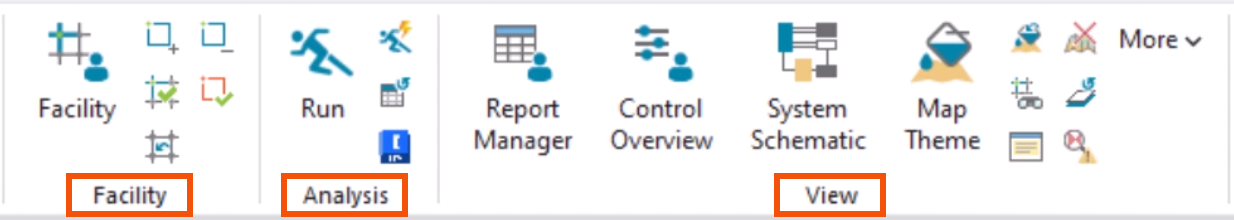
- The Facility group is similar to the Domain group, and it contains the Facility Manager, which controls the active facility set.
- Once all required databases are populated, use the tools in the Analysis group to run simulations.
- The View group contains tools for viewing simulation results, overview information, schematics, and map theme controls. You can also add or remove interface windows, like the Model Explorer and Message Board.
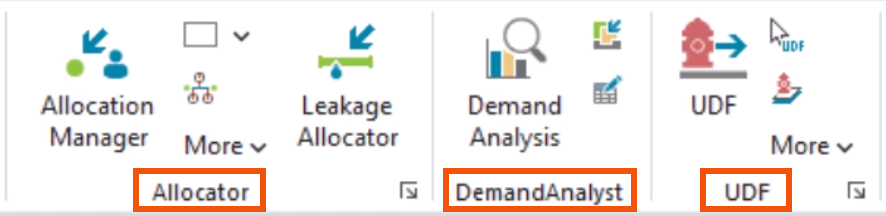
- The Allocator group contains the Allocation Manager, which provides a means to allocate all demands (water consumption) to junctions from water usage data. This data typically comes from a meter or polygon layer. There are additional tools to create/edit polygons, create a meter layer from a spreadsheet, or change junction/pipe-meter assignments.
- In the Demand Analyst group, the Demand Analysis provides accurate real-time water demand estimates.
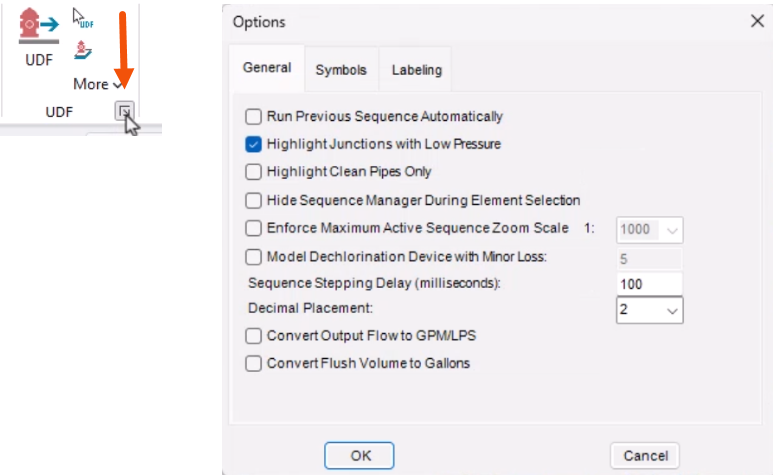
- The UDF group has tools for designing and managing unidirectional flushing sequences.
Notice that the Allocator and UDF groups have extra options that are accessible by clicking the dialog box launcher in the corner of the grouping.
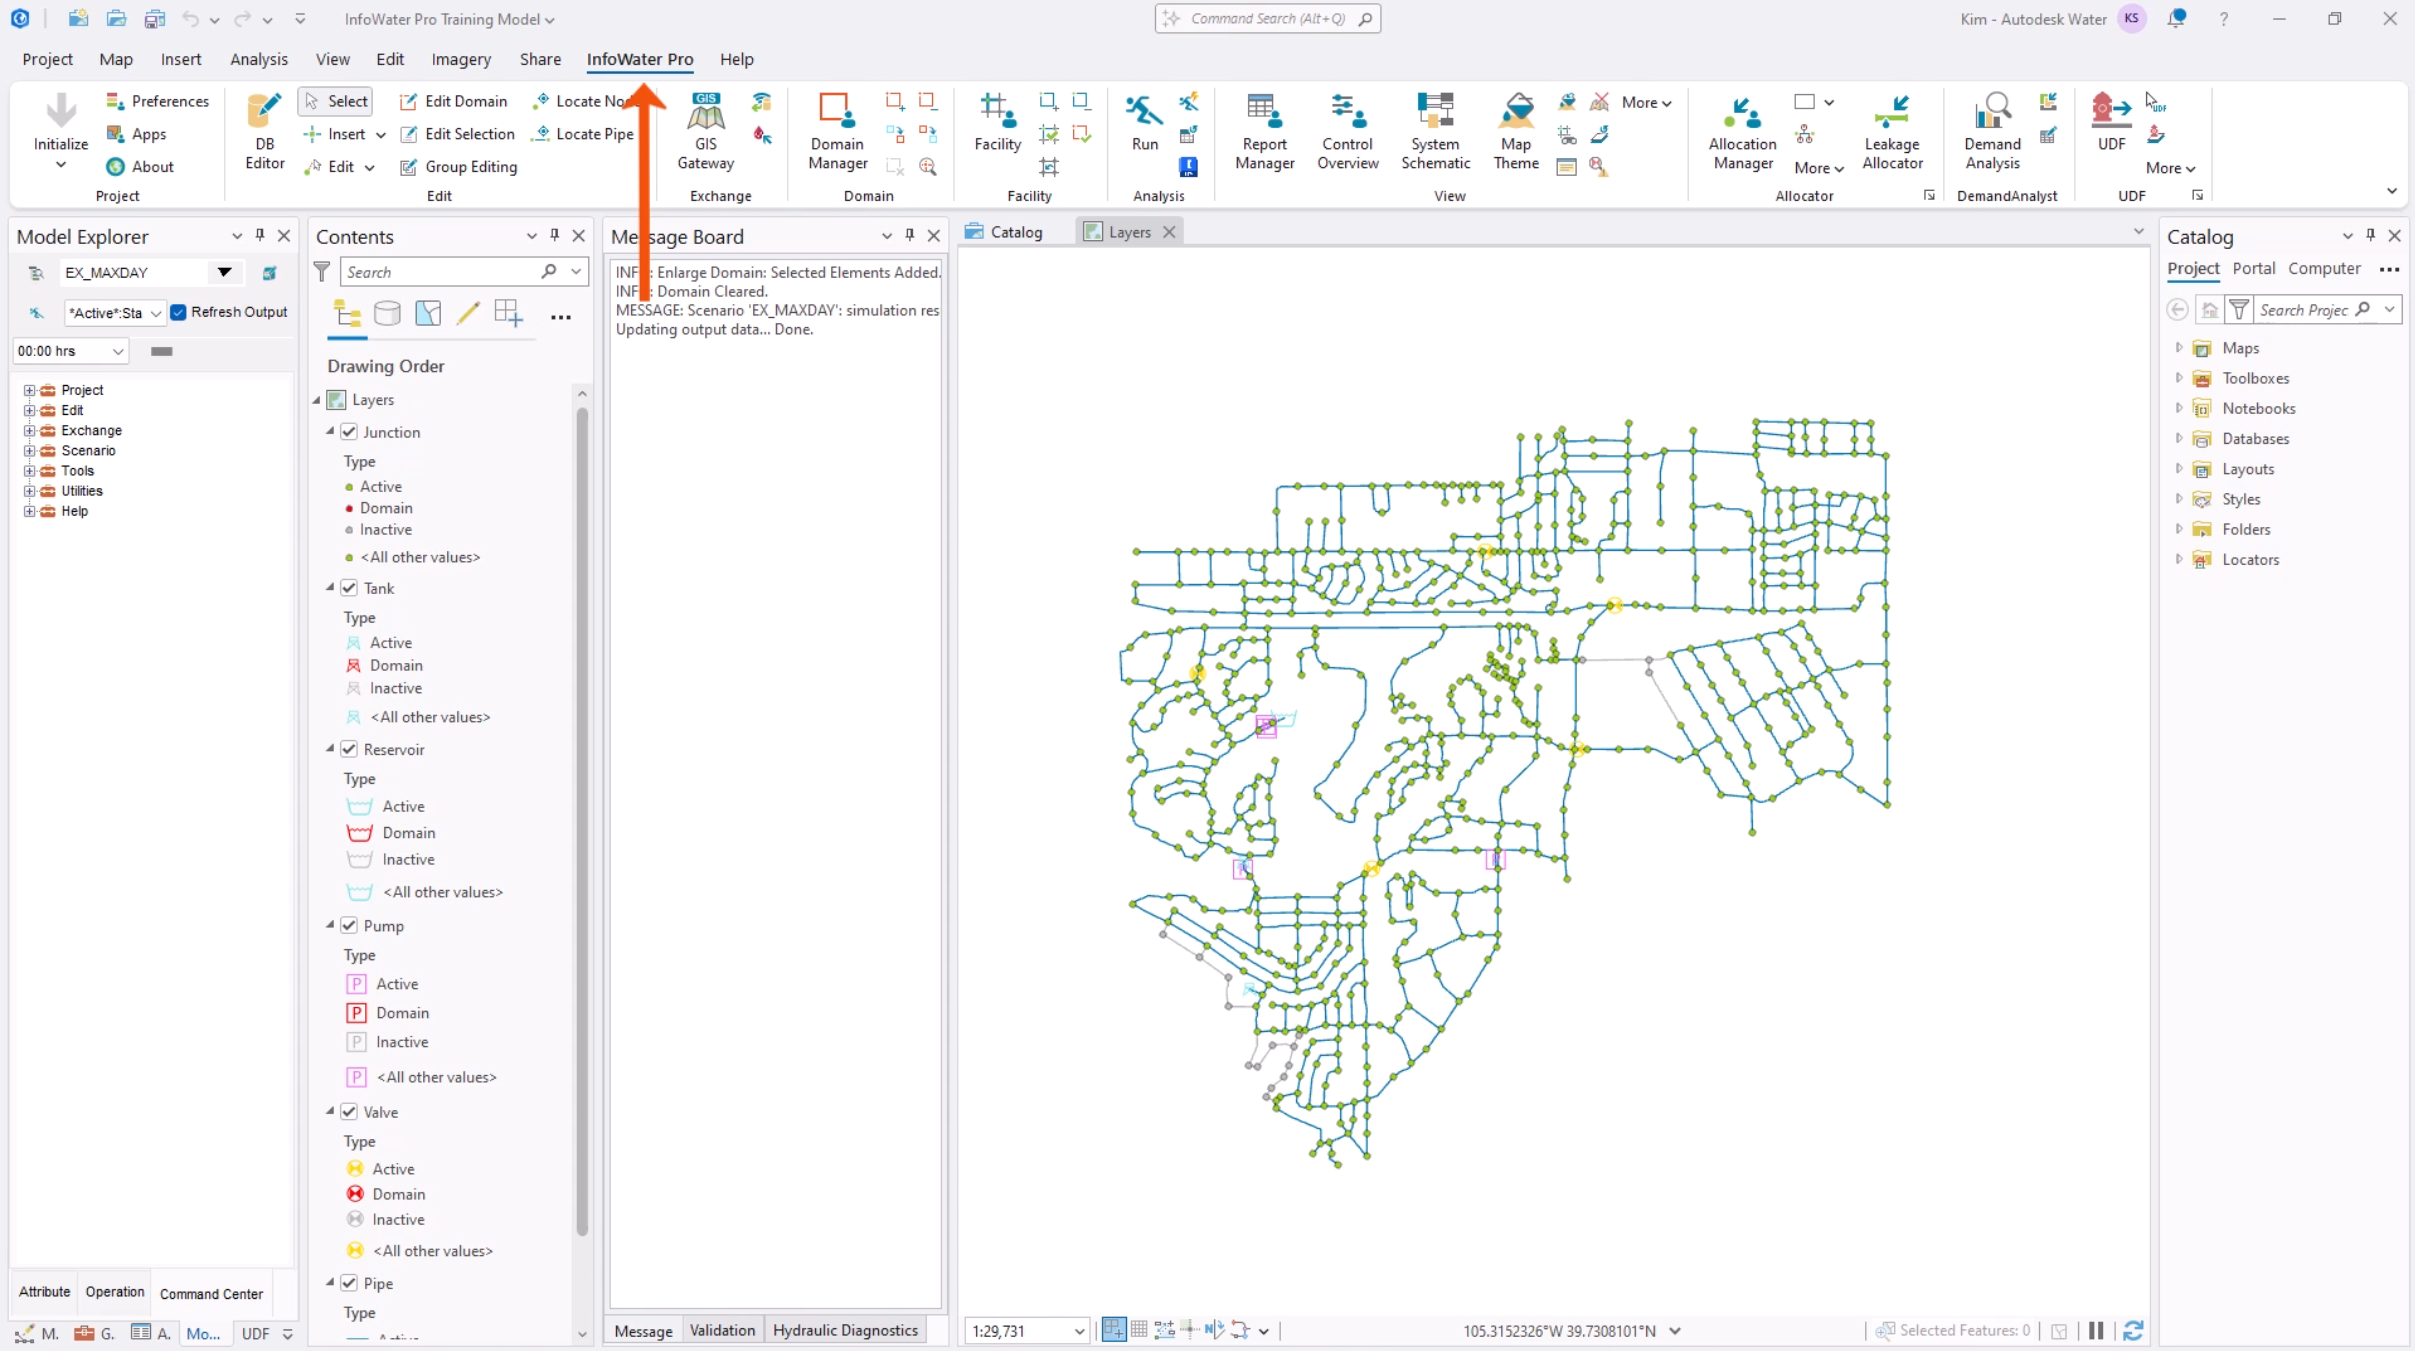
When working on a project, InfoWater Pro adds the Model Explorer and Message Board panels to the existing ArcGIS panels below the ribbon—the model, Contents, and Catalog.
The Model Explorer is one of the most-used parts of the interface, and it has three tabs.
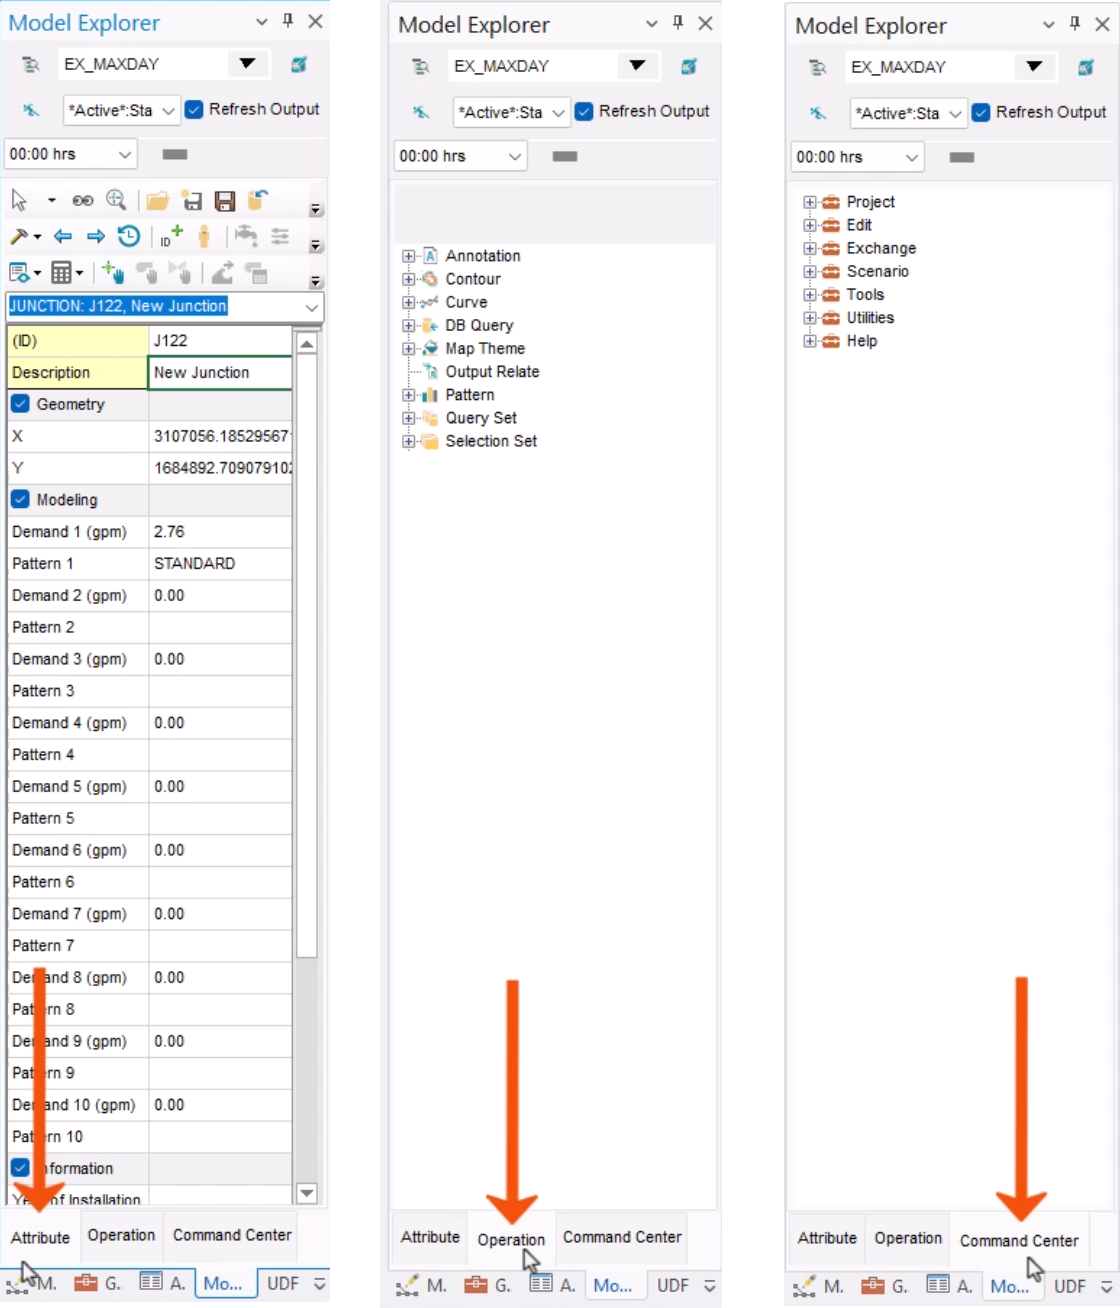
- Use the Attribute tab to activate a scenario, choose an output source, view the information of a selected element, and access all hydraulic modeling objects, such as curves and patterns. There are also controls and tables for simulation or element-specific modeling inputs.
- The Operation tab has linkages to some tools all over InfoWater Pro, such as database queries and the map theme from the ribbon, pattern/curve creation, simulation settings, and more.
- The Command Center tab contains many database controls. From here, change spatial reference, access additional import/export tools, use scenario controls or connectivity review tools, perform a database cleanup, access help documents, and more.
The Message Board displays various messages pertaining to the model and hydraulic simulations, such as warnings, errors, and successful run messages.
These panels can be moved, closed, or hidden, allowing flexibility in the arrangement of the work area.