Step-by-step guide
The InfoAsset Manager workspace offers intuitive navigation and flexibility, featuring a configurable interface that can be adjusted to your preferred way of working.
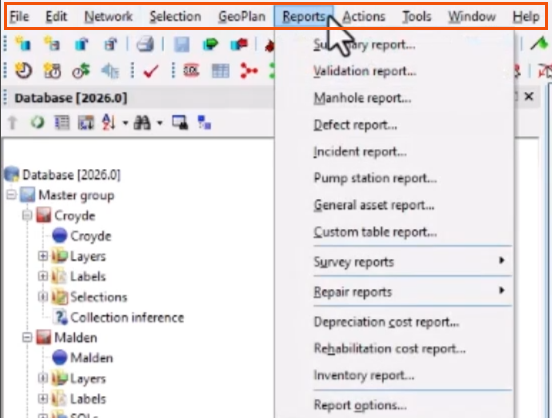
The menu bar at the top of the interface organizes options by functionality and includes menus such as Network and Reports.
Toolbars are typically anchored at the top of the window and provide easy access to common functions. They can be customized by changing their contents, position, and visibility.

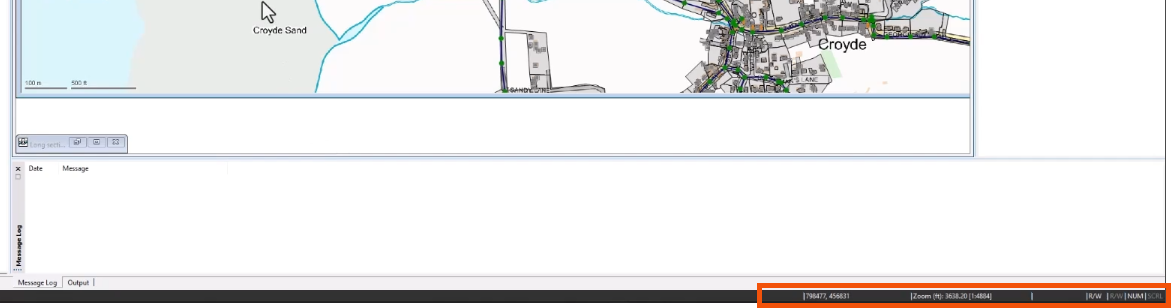
At the bottom of the interface, the status bar provides additional information, such as the zoom or scale level on the GeoPlan Window.
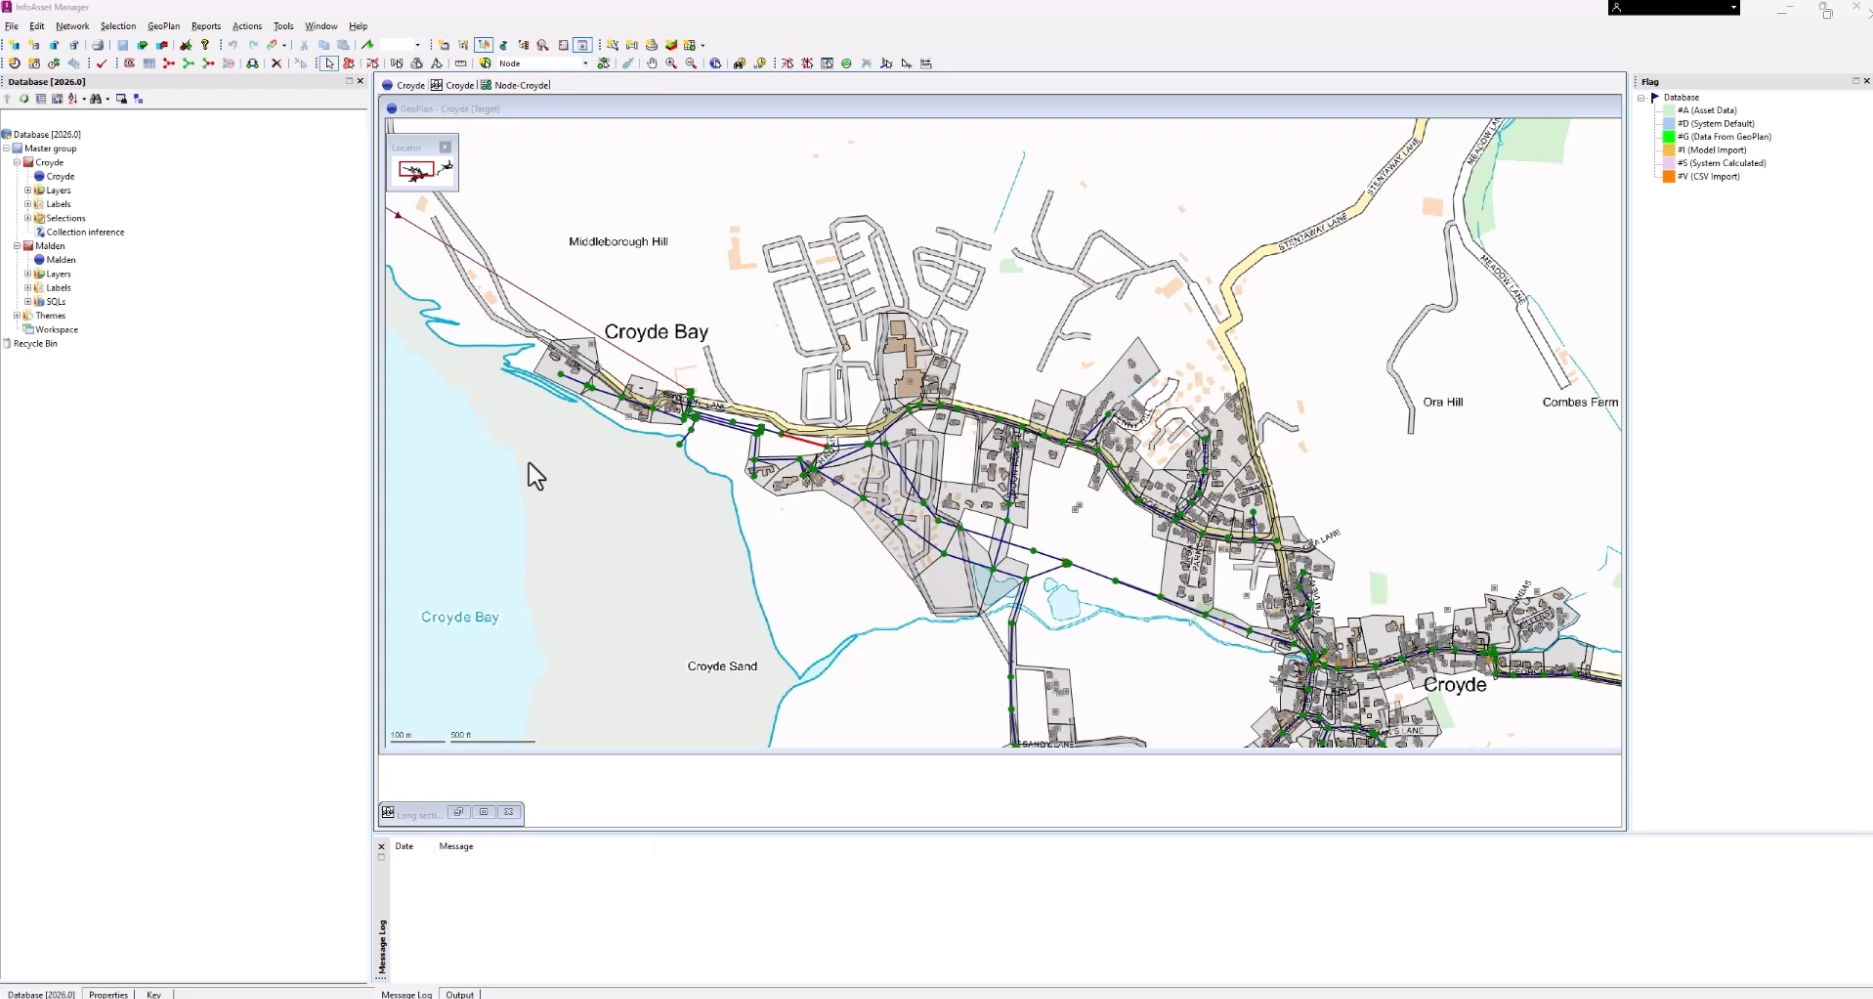
The Main Window is the large area between the toolbars and status bar and includes several different parts. The content and layout are configurable, but it defaults to the arrangement below.
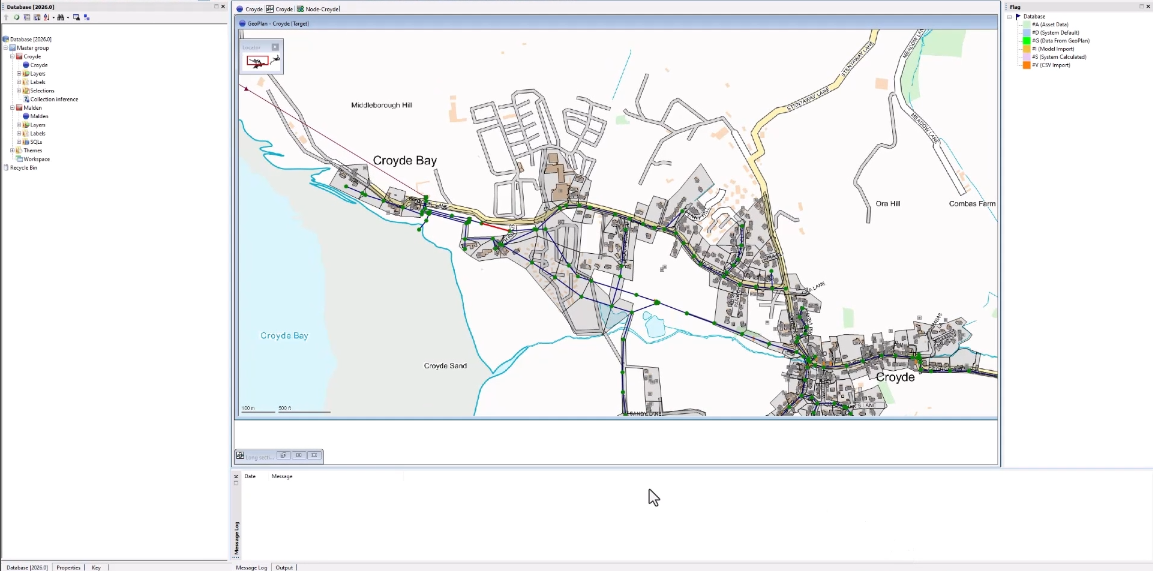
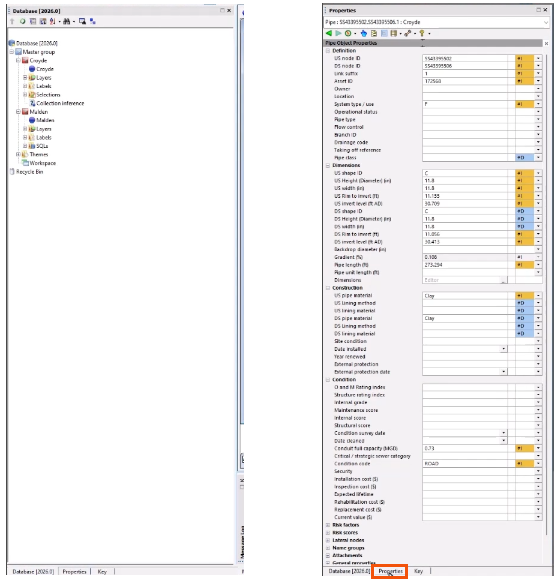
On the left is the Explorer Window, a hierarchical representation of the data within the current database. Use the tabs to display other windows in this location. For example, the Properties tab displays the Object Properties Window, which shows the property sheet for a selected network object.
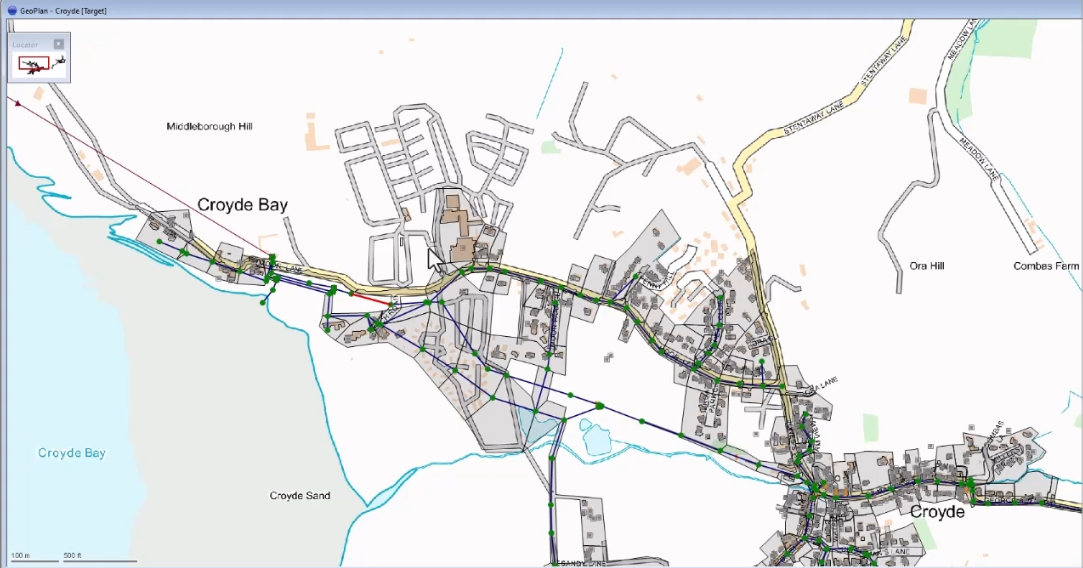
The middle area is the GeoPlan Window, which shows a geographical representation of the network. This view can be displayed over the top of a map or other additional data.
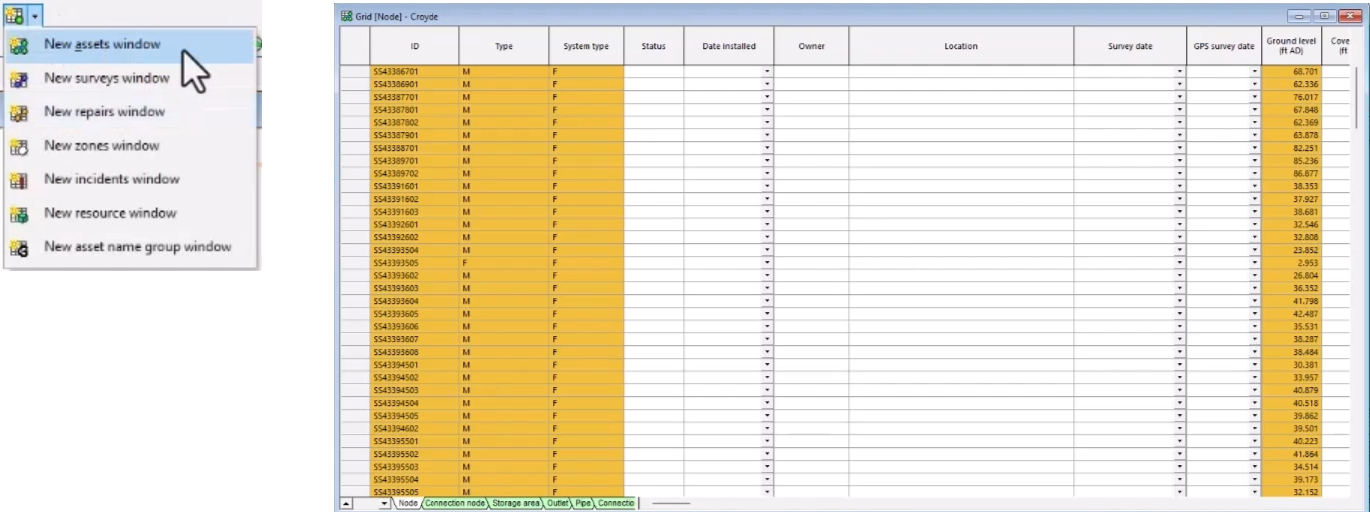
Other windows may be displayed here as well. For example, from the Windows toolbar, expand the Grid windows drop-down and select New assets window to open a Network Object Grid Window. This spreadsheet-style window lists objects in the network.
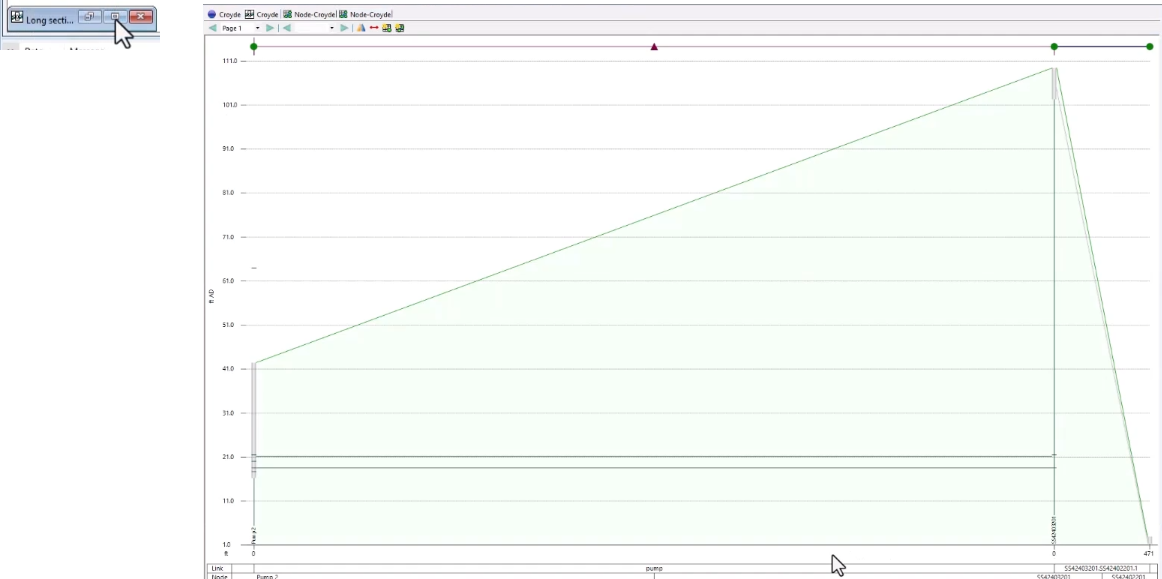
At the bottom of the main window, the Long Section Window displays a cross-section through the length of a selected run of network objects. Below, the window is maximized for a larger view.
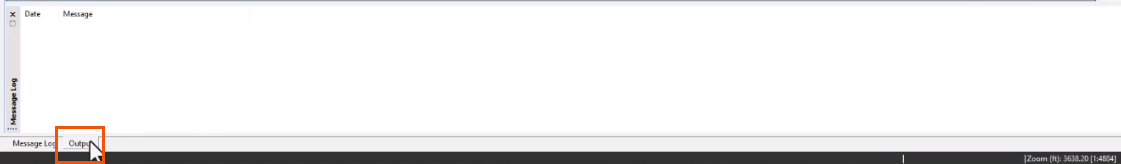
In this area, you can also view an Output Window, which lists errors or warnings following a network validation.
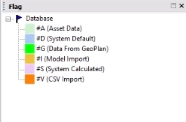
On the right side of the Main Window, the Flag Window displays the available data flags for the current database.
All toolbars and some windows, such as the Explorer Window, can be docked to any side of the main window that does not already contain a toolbar or menu bar.
A window or toolbar can also be undocked by dragging it to float within or outside of the application window. To reposition a docking window, drag its title bar.
More information can be accessed directly within InfoAsset Manager by expanding the Help menu and selecting Help topics.
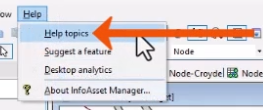
Alternatively, press F1 to display the corresponding help topic for the currently active interface element.


