Creating a color-coded map of pressure and velocity
Step-by-step guide
To help visualize steady state simulation results, create a color-coded thematic map based on attribute values. In this example, create a map of the pressure and velocity results.
- To open ArcGIS Pro, double-click the desired project .aprx file.
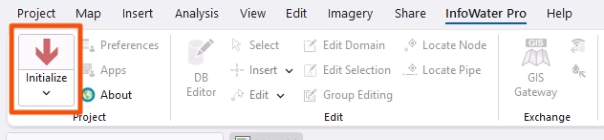
- Click the InfoWater Pro tab.
- In the Project panel, click Initialize.
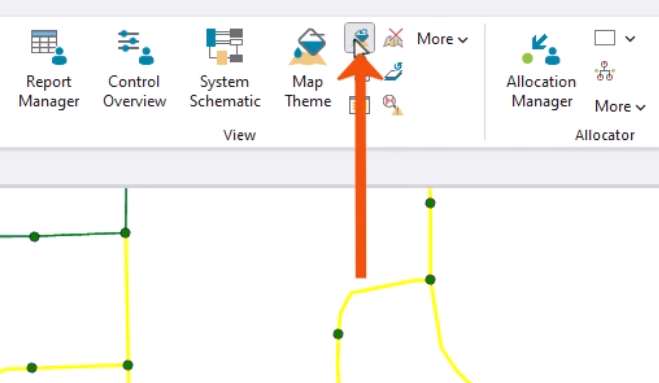
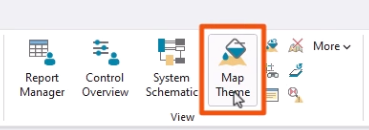
- On the ribbon, in the View panel, click Map Theme.
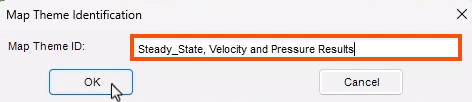
- In the Map Theme Identification popup, give the theme a name, such as “Steady_State, Velocity and Pressure Results”.
- Click OK.
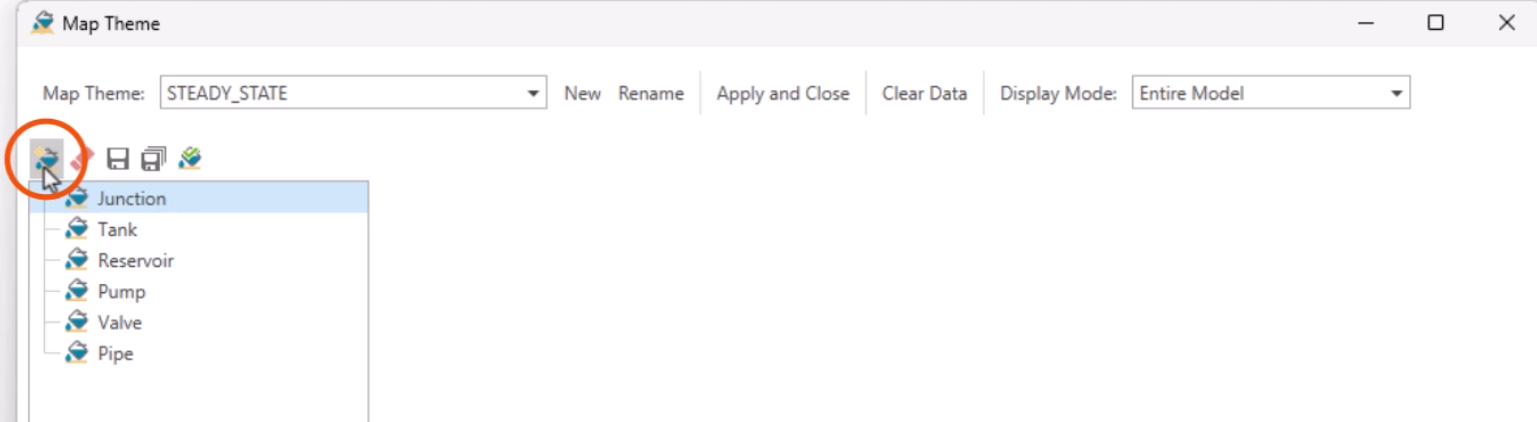
In the Map Theme dialog box, configure the map theme to display the needed information.
- Select Junction from the element type list.
- Click New to create a new junction sub-theme.
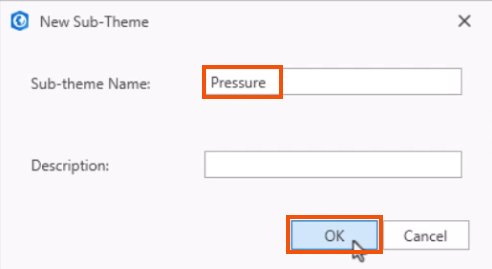
- In the New Sub-Theme dialog, give the sub-theme a name, such as “Pressure”.
- Click OK.
- In the Standard Sub-Theme window, Data Source group, set the Table drop-down to Output.
- Set the Field drop-down to Pressure (psi).
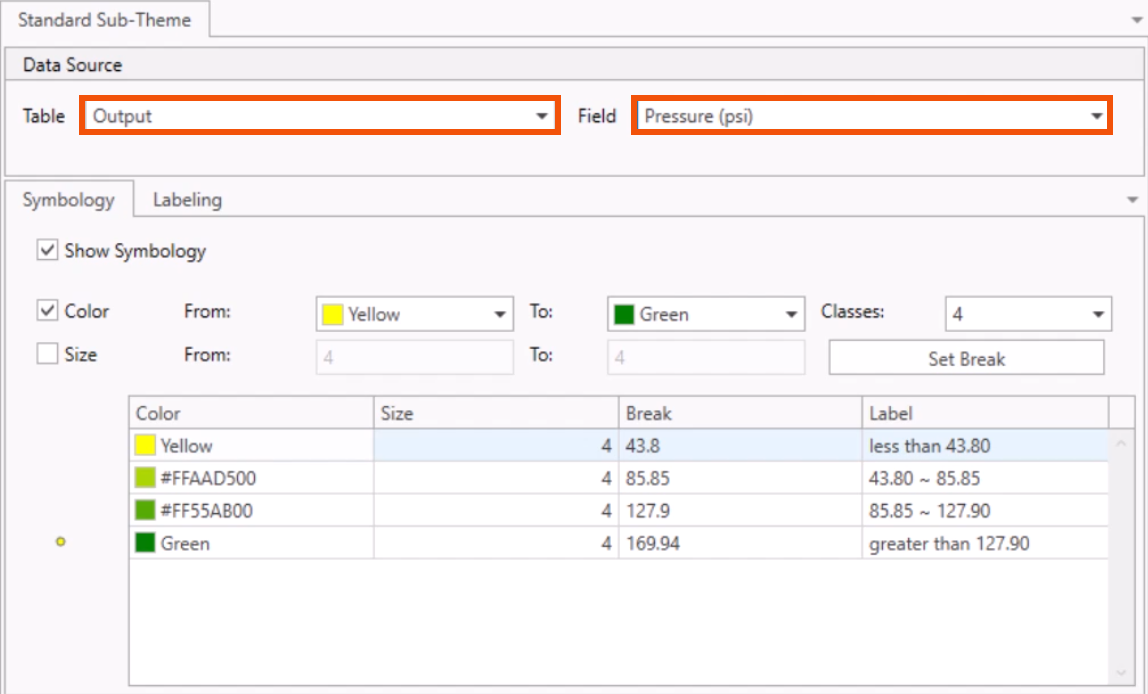
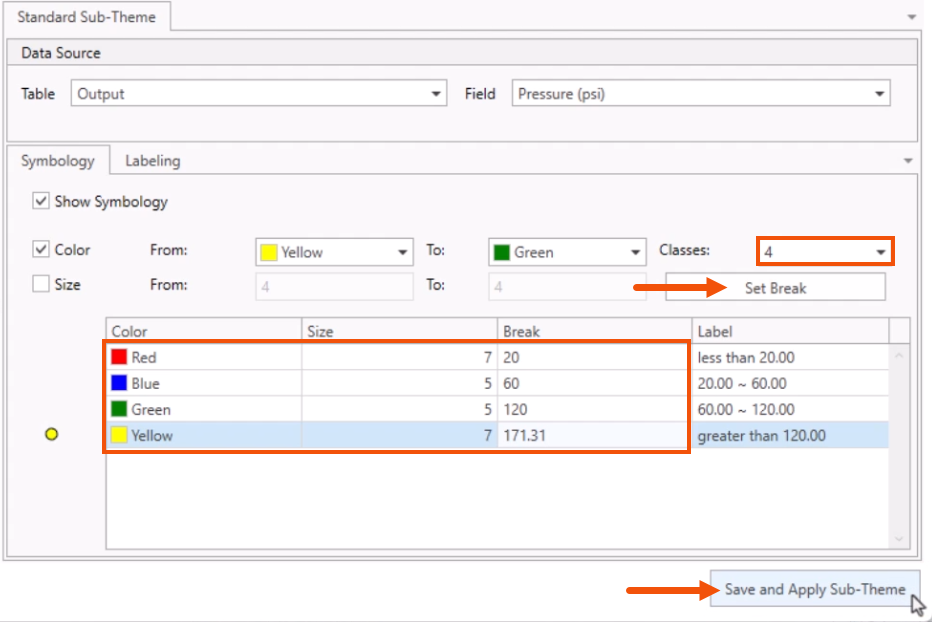
- On the Symbology tab, set Classes to 4.
- Click Set Break.
- In the table, change the settings as follows:
- Row 1: Color Red, Size 7, Break 20.
- Row 2: Color Blue, Size 5, Break 60.
- Row 3: Color Green, Size 5, Break 120.
- Row 4: Color Yellow, Size 7, Break 171.31.
- Click Save and Apply Sub-Theme.
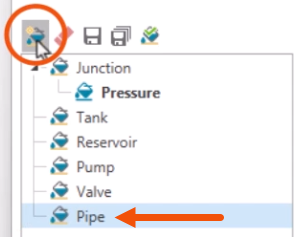
Now, create a new pipe sub-theme.
- Select Pipe for the element type.
- Click New.
- In the New Sub-Theme dialog, give the sub-theme a name, such as “Velocity”.
- Click OK.
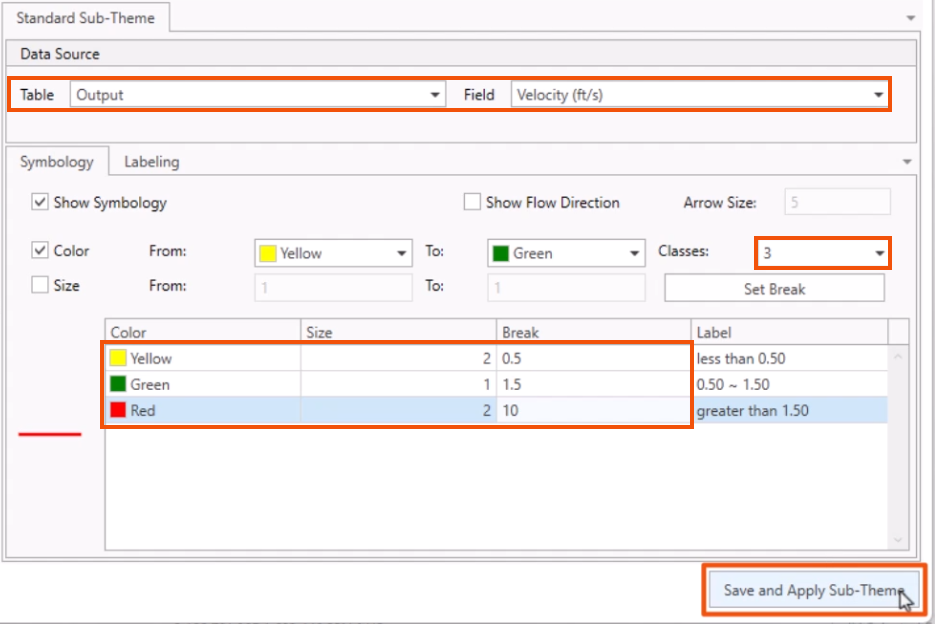
- Set the Table to Output, Field to Velocity (ft/s), and Classes to 3.
- Click Set Break.
- In the table, change the settings as follows:
- Row 1: Color Yellow, Size 2, Break 0.5.
- Row 2: Color Green, Size 1, Break 1.5.
- Row 3: Color Red, Size 2, Break 10.
- Click Save and Apply Sub-Theme.
- Close the Map Theme dialog.
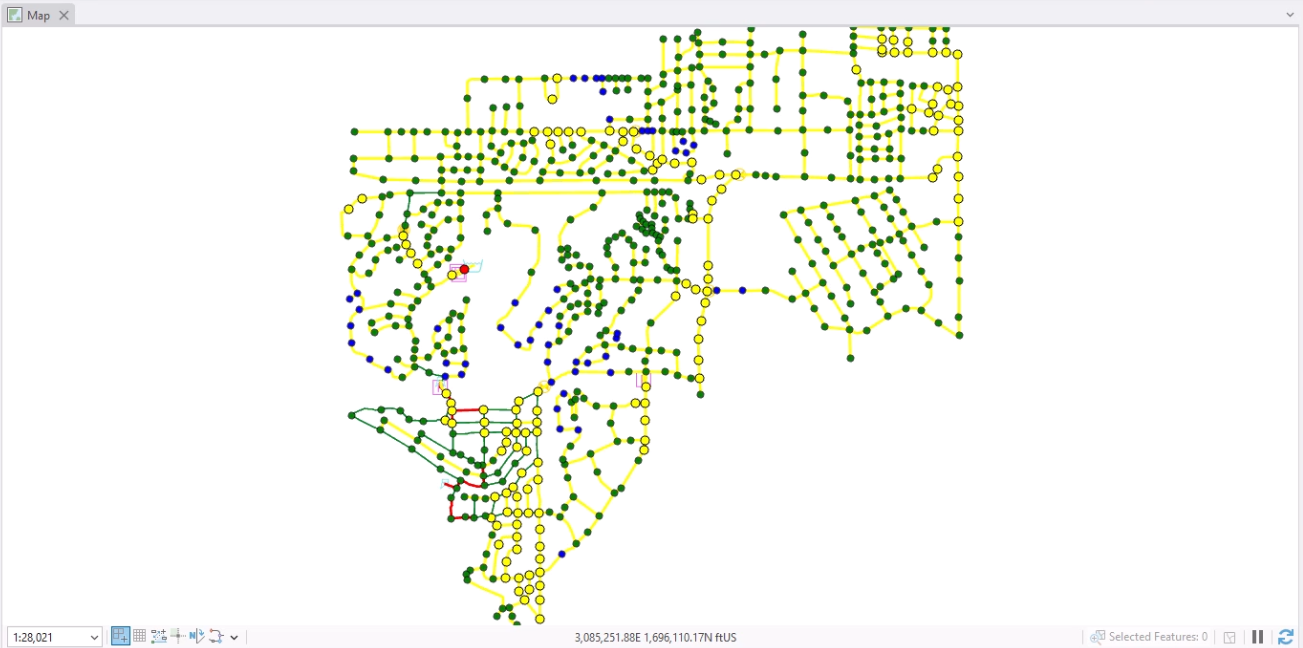
- Zoom to the extents of the model.
The map shows the pressure and velocity displayed by these color-coded ranges.
- Zoom into any areas that may require further review.
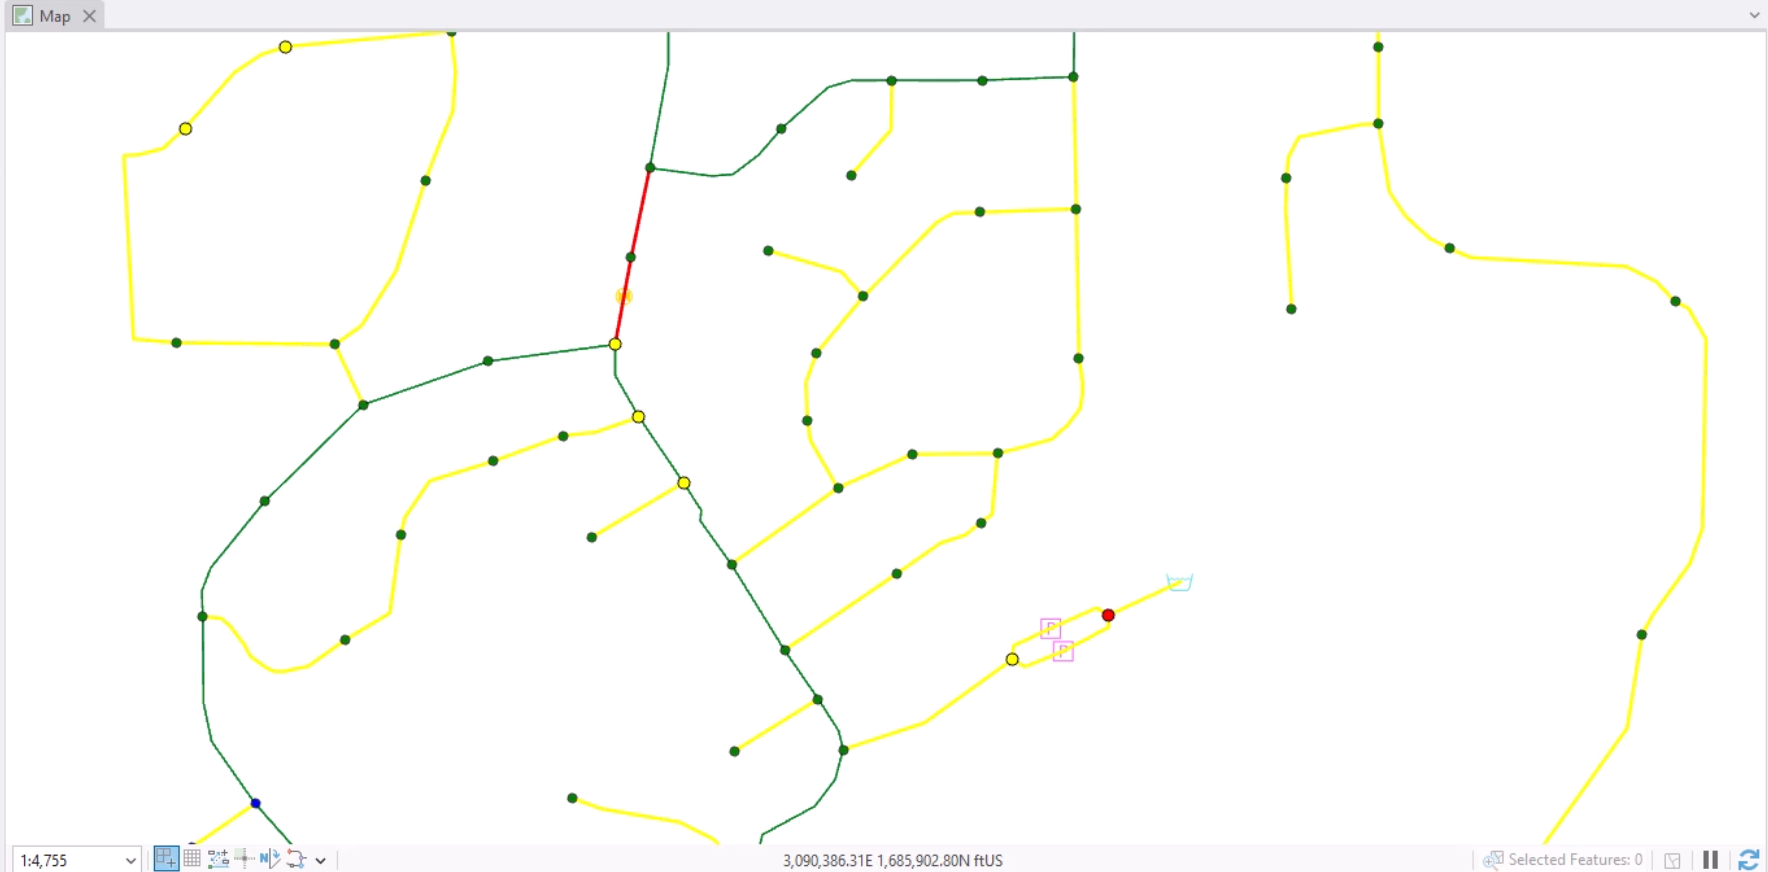
Realize that because this is based on a steady state analysis, this is just a snapshot in time for this system. It is also possible to create a thematic map based on a time varying output.
To reset the display to the default, as set in the Preferences:
- On the ribbon, View panel, click Reset Map Theme.