Step-by-step guide
To best understand how InfoSurge Pro performs a surge analysis, it is a good idea to experiment with a simple single-pipe model. This facilitates identification of the various concepts and common procedures involved in running simulations and examining the results.
- Double-click the desired project .aprx file to open ArcGIS Pro.
- Click the InfoWater Pro tab to open the InfoWater Pro ribbon.
- In the Project panel, click Initialize.
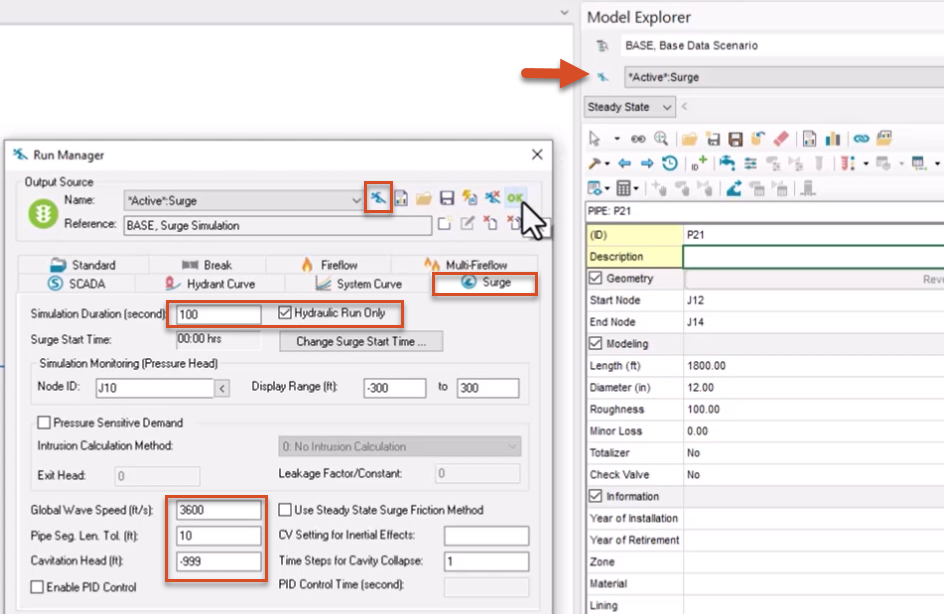
- From the Model Explorer, click Run Manager to open the Run Manager dialog box.
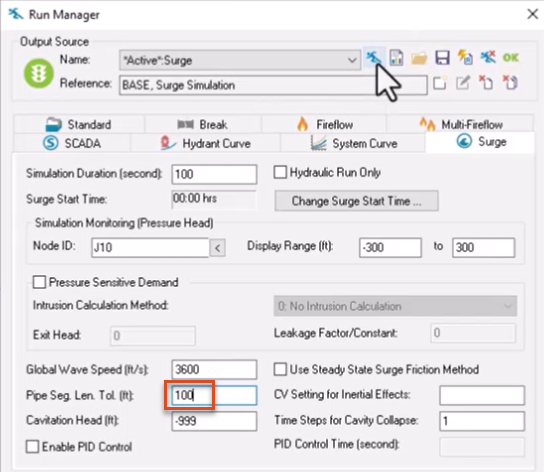
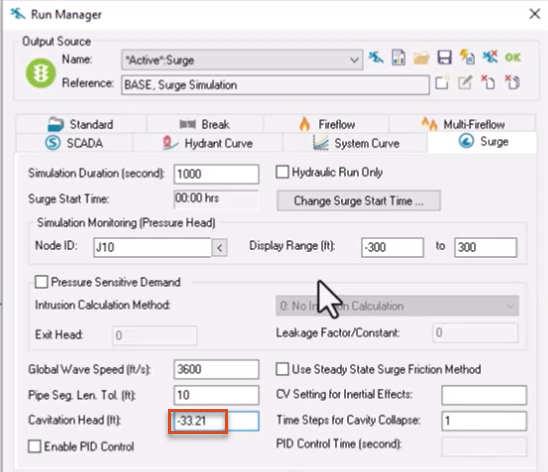
- Switch to the Surge tab.
- Set the Global Wave Speed to 3600 feet per second.
- Set the Pipe Segment Length Tolerance to 10 feet.
- Set the Cavitation Head to -999 feet.
Cavitation head is the head at which fluid will cavitate. Note that this is a hypothetical value, as it is typically around -33 feet.
- Set the Simulation Duration to 100 seconds.
- Enable Hydraulic Run Only.
- Click Run to run a hydraulic simulation.
- Click OK to close the Run Manager.
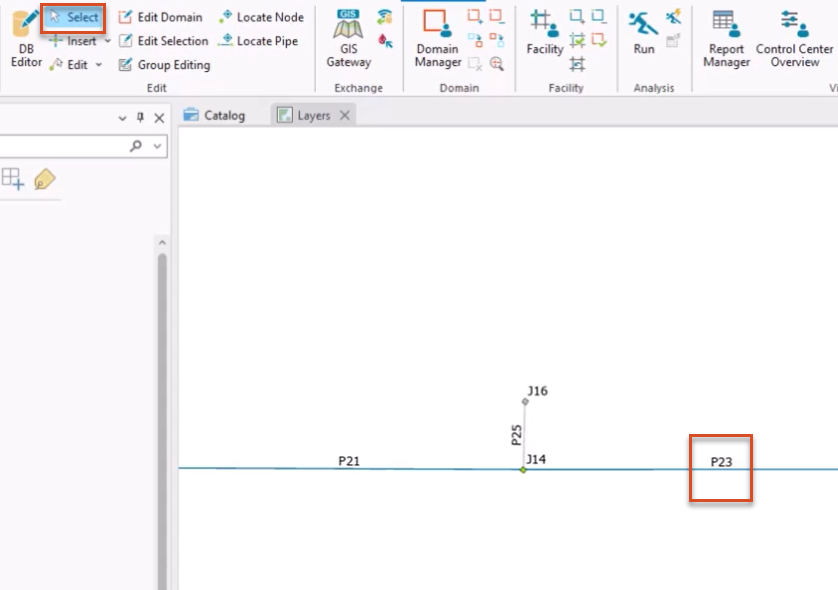
- From the ribbon, Edit Panel, click the Select tool.
- Select the pipe with the ID P23.
- In the Model Explorer, scroll down to view the hydraulic results for the steady state simulation.
In this example, the Pipe Flow is 2663.98 gallons per minute, with a Velocity of 7.56 feet per second.
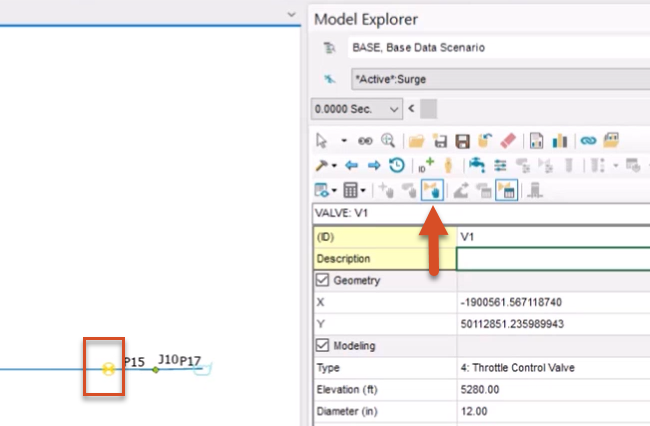
- From the map, select valve V1 to view its hydraulic results.
Note that the Upstream Hydraulic Pressure is 3.86 psi.
- Use these results to calculate the approximate surge pressure immediately upstream of Valve V1 using the Joukowski equation.
This equation multiplies the change in velocity by the pipe wave speed, and then divides this number by gravity, resulting in the change in hydraulic head, in feet. The final calculation, to convert this head value to pressure, is to divide by 2.31.
For this example, the simulation calculates results as a steady state, so the velocity 7.56 feet per second is used. The selected pipe does not have a wave speed, so the global wave speed of 3600 feet per second is used. To maintain the correct units for these calculations, gravity is 32.2 feet per second squared. Using these numbers, the final calculation for the potential surge pressure is 365 psi.
Valve V1 is a surge Active Valve (AV), assigned a stem change curve that closes the valve within 10 seconds. To view the upstream pressure profile of the valve:
- Reopen the Run Manager.
- Disable Hydraulic Run Only.
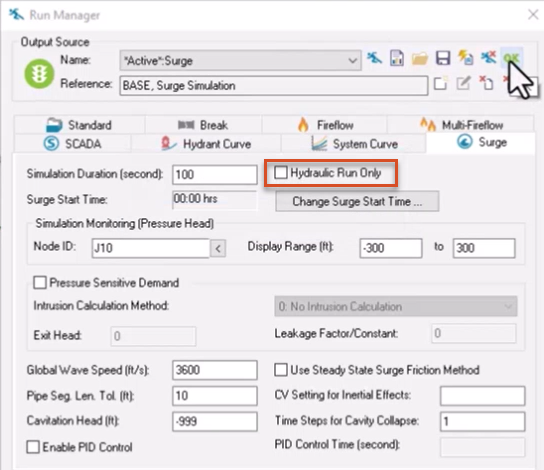
- Click Run to run another surge analysis.
- When it completes, click OK.
- From the ribbon, View panel, click Report Manager.
- In the Report Manager dialog box, click New.
- In the Output Report/Graph dialog box, under Available Output Source, select *Active*:Surge.
- From the Graph Report tab, pick Surge Pump/AV Graph.
- Click Open.
- From the map, select valve V1 to view its upstream pressure profile graph.
- Click Report.
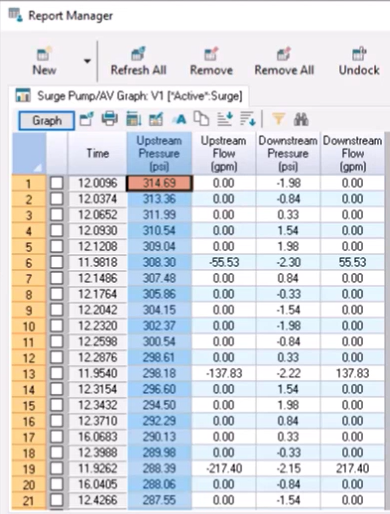
- Right-click the Upstream Pressure (psi) header, and then pick Sort Descending to move the largest value to the top row.
In this example, the maximum surge pressure upstream peaks at 314.69 psi.
- Click Hide to close the Report Manager.
Now, change the closure time of valve V1 to see how it impacts results.
- Select valve V1 again.
- From the Model Explorer toolbar, click AV (TCV) Operation Change.
- In the dialog box that opens, next to the Stem Change Curve drop-down, click Browse (…) to open the Curve dialog box.
- With STEMCHANGECURVE selected, in the curve table, adjust the value in the third row of the X column to 4.
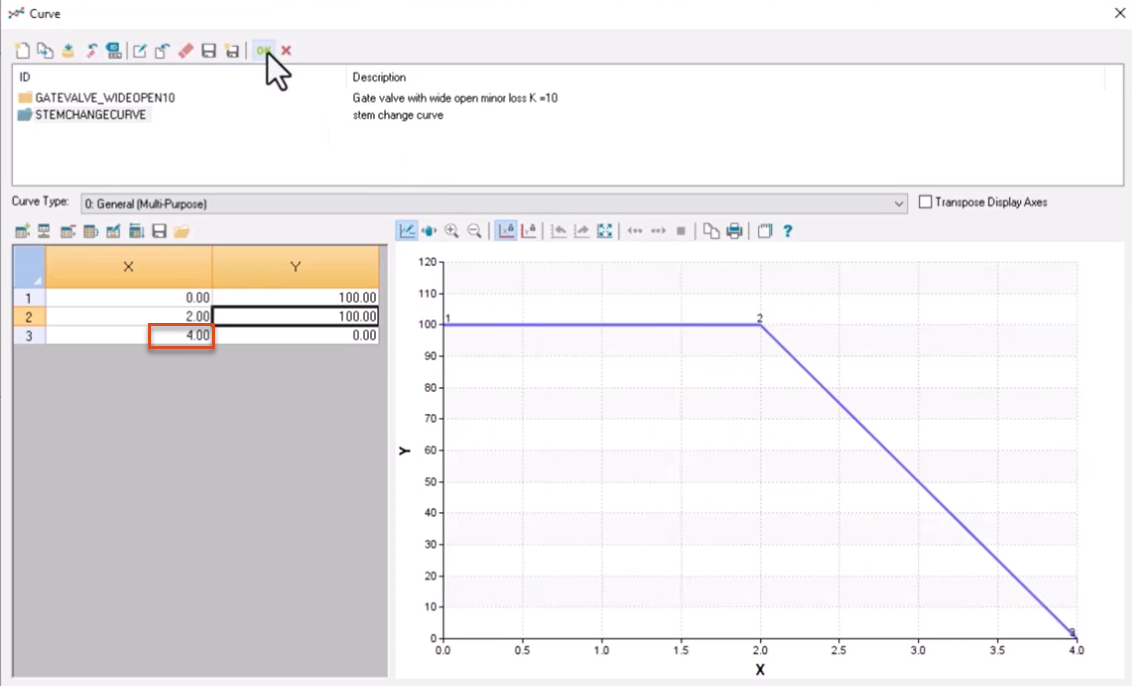
This decreases the valve time from 10 seconds to 2 seconds.
- Click OK to save the changes and close the dialog box.
- In the AV (TCV) Operation Change Data dialog box, click Update.
- Open the Run Manager and Run another analysis.
- When complete, click OK.
- Reopen the Report Manager and click Refresh All to update the results.
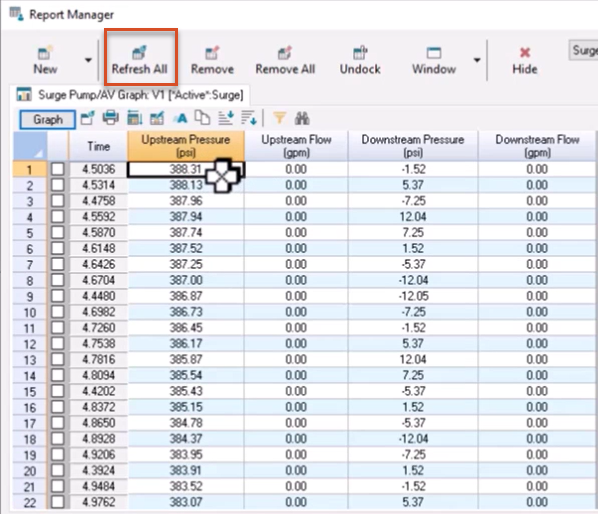
With the decrease in closure time, the maximum upstream pressure increased to 388.31 psi.
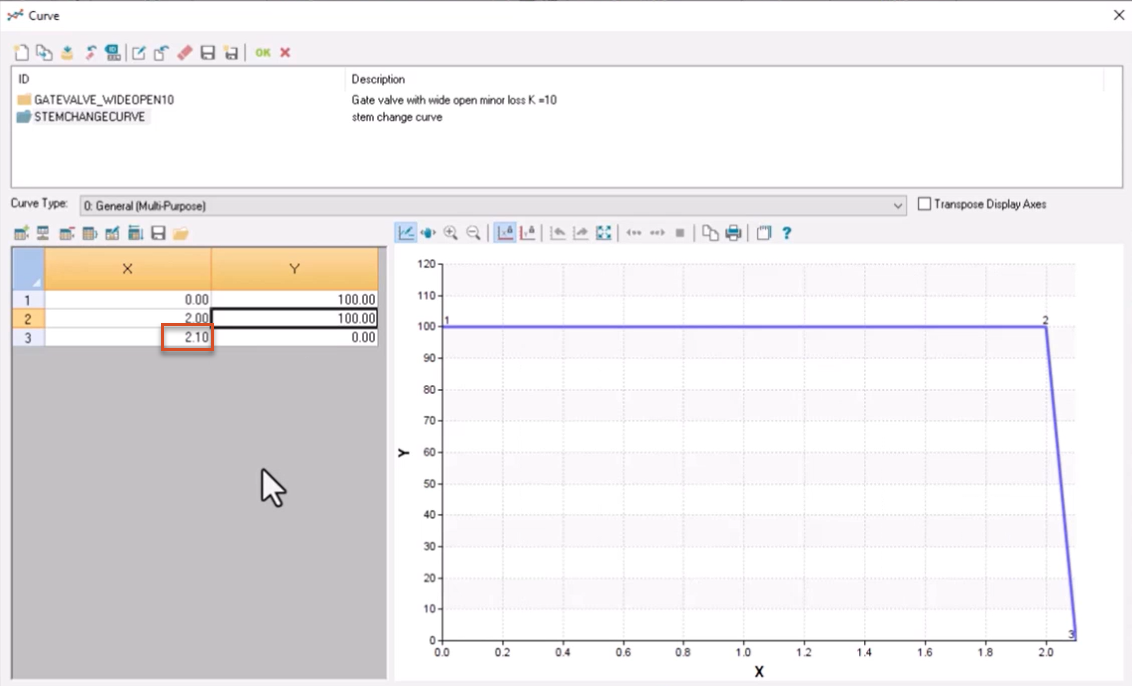
- Repeat steps 32-24 to change the valve closure time to 2.10. This changes the closure time to 0.1 seconds.
- Run another surge analysis.
- View the results in the Report Manager, making sure to click Refresh All.
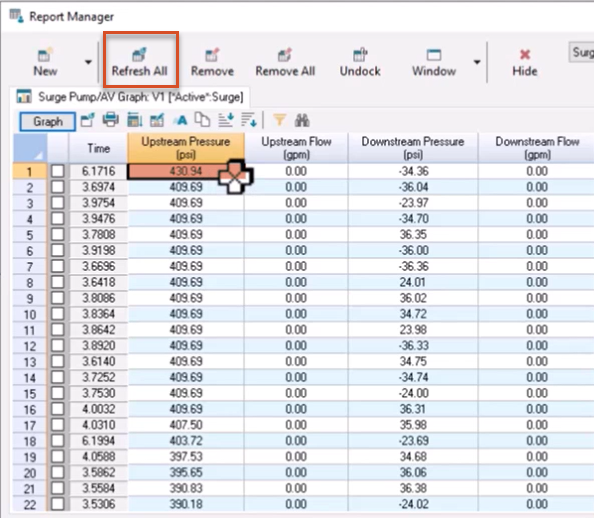
In this example, the maximum upstream pressure increased again to 430.94 psi.
- Click Hide to close the Report Manager.
Try making various other changes to the network and perform additional runs to see how they impact results.
To simulate the effect of changing the pipe segment length tolerance:
- Select valve V1.
- In the Run Manager, Surge tab, set the Pipe Segment Length Tolerance to 100 feet.
- Run an analysis, and click OK when complete.
- Open the Run Manager again and change the Pipe Segment Length Tolerance to 1 foot.
- Run another analysis, and click OK when complete.
- Open the Report Manager to view the results, noting the changes in maximum upstream pressure and the time each run takes to complete.
Generally, the larger the pipe segment length tolerance value, the longer the run takes to complete.
To simulate a dead end wave reflection:
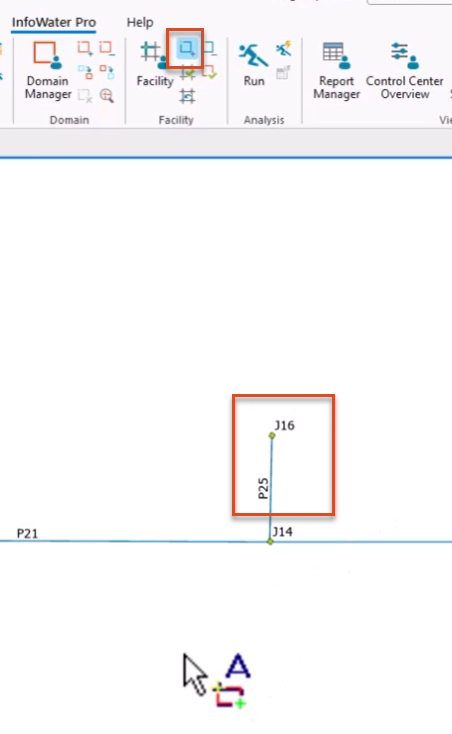
- From the ribbon, Facility tab, click Activate Facility.
- With the tool active, on the map, click and drag to select pipe P25 and junction J16.
- From the Edit panel, enable the Select tool.
- Reopen the Run Manager.
- Change the Pipe Segment Length Tolerance to 100 feet.
- Enable Hydraulic Run Only.
- Click Run to perform another run.
- When complete, click OK.
- From the map, pick junctions J16 and J14 in turn to view their results in the Model Explorer.
Observe that both junctions have a static pressure of 23.59 psi.
- Open the Run Manager and disable Hydraulic Run Only.
- Run the simulation one more time.
- Close the Run Manager.
- Open the Report Manager to view results for J14 and J16, noting their maximum pressures.
In this example, the pressure at J16 is higher than it is for J14. Because J16 is a “dead end,” the transient wave is reflected here at twice the pressure head of the original wave.
To simulate how friction impacts pipe flow over time:
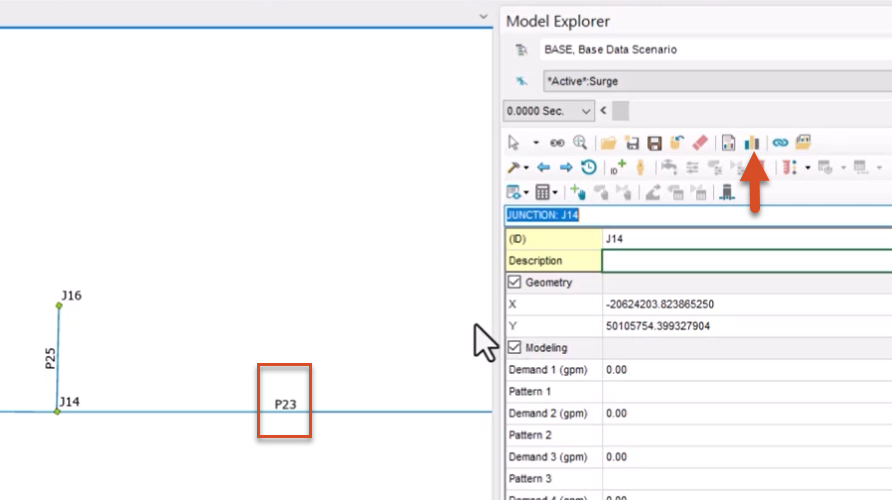
- With the Select tool active, select pipe P23 in the map.
- From the Model Explorer, click Graph to view its flow profile, with flow decreasing as time progresses.
- Open the Run Manager.
- In the Surge tab, change the Simulation Duration to 1000 seconds.
- Run another surge analysis.
- Open the Report Manager and click Refresh All.
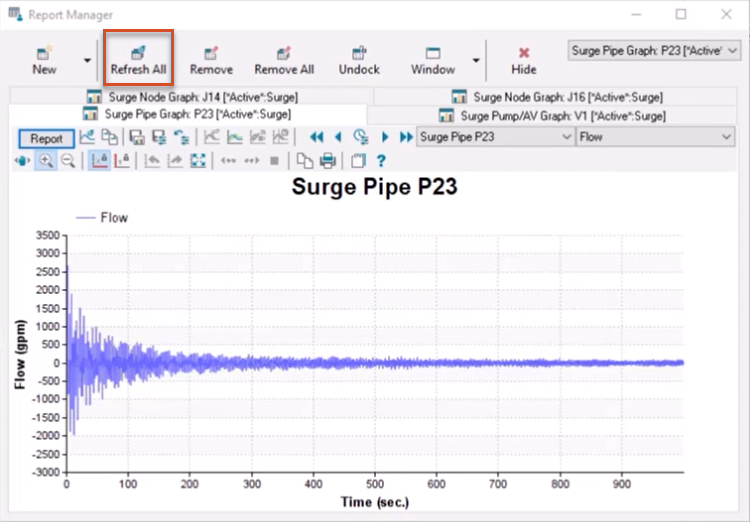
Note that by viewing results over a greater time, the pipe flow eventually approaches a steady state.
To simulate a cavitation event:
- Open the Run Manager.
- In the Surge tab, adjust the Cavitation Head to -33.21 feet.
- Run another surge analysis.
- Open the Report Manager and review refreshed results for valve V1.
Note that the surge pressure does not approach 0 over time. This is because the cavitation head changed from -999 to -33.21 feet, the head at which cavitation typically occurs.


