Set visual effects in InfoAsset Manager
Step-by-step guide
In InfoAsset Manager, the GeoPlan allows control of visual effects, such as selection color, hill shading settings, theme keys, and theme graphic quality.
To access the visual settings:
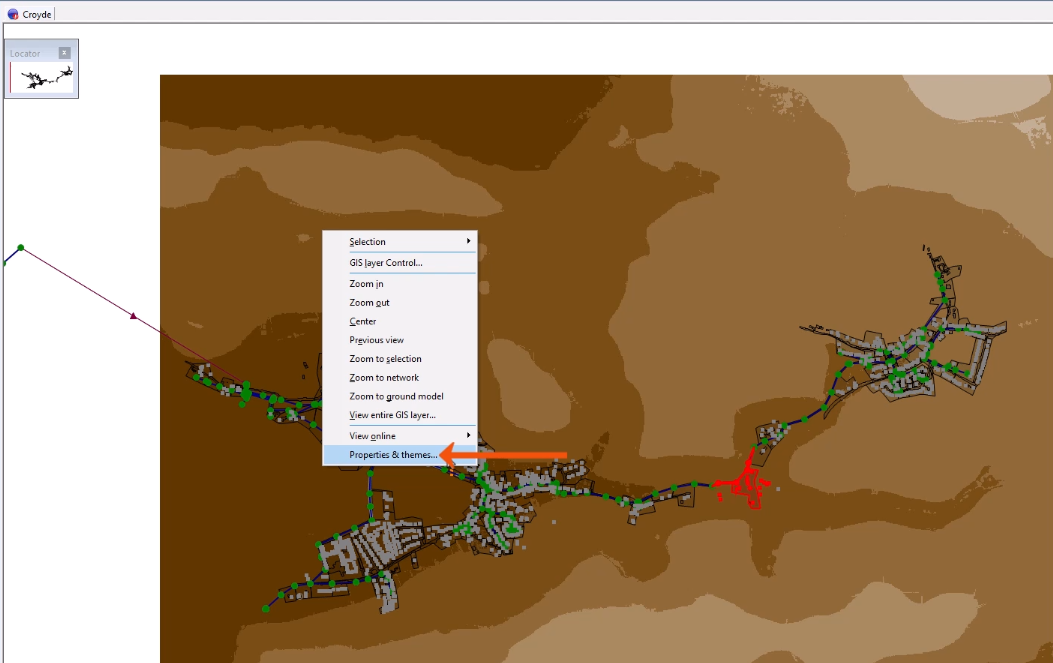
- Right-click the GeoPlan and select Properties & Themes.
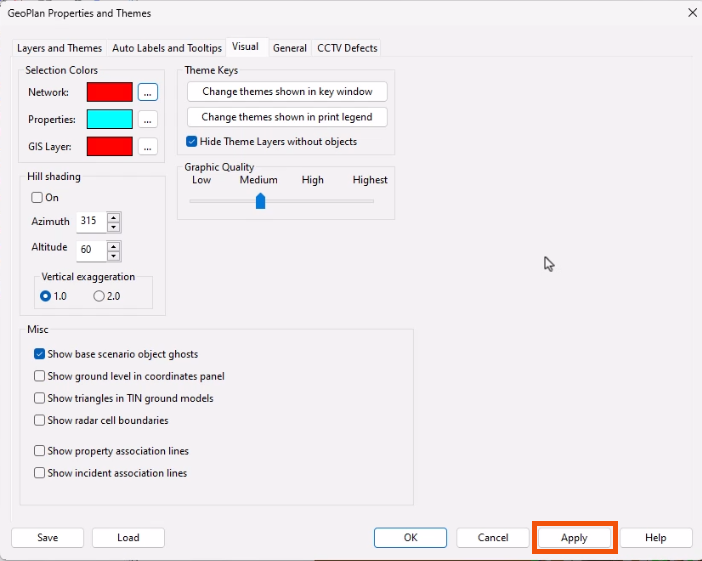
- In the Properties and Themes dialog, switch to the Visual tab to explore the various options.
- Click Apply to see the effect of changes on the GeoPlan.
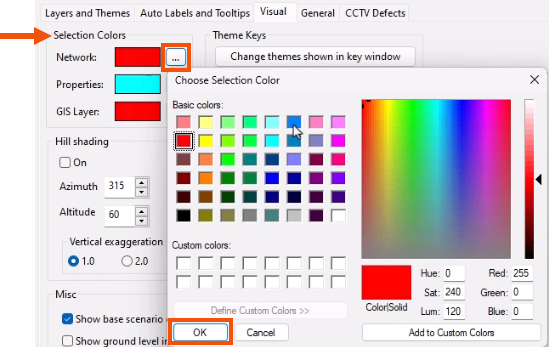
To change the Selection Colors for objects displayed on the GeoPlan:
- In the Selection Colors group, click More (…) next to one of the options, such as Network.
- In the Color picker, select a new color.
- Click OK.
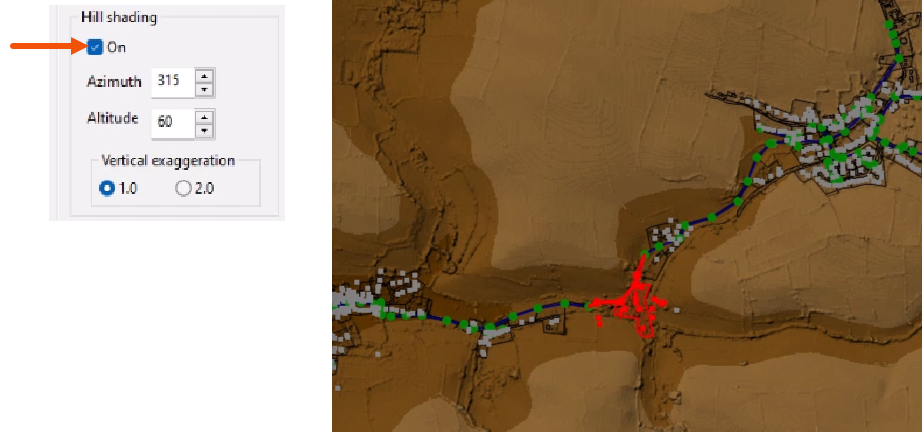
Hill shading simulates a light source (the sun) and can be pointed towards the model. The best hill shading effects are found by trial and error and vary depending on the ground model.
- In the Hill shading group, select On.
- Adjust the settings accordingly.
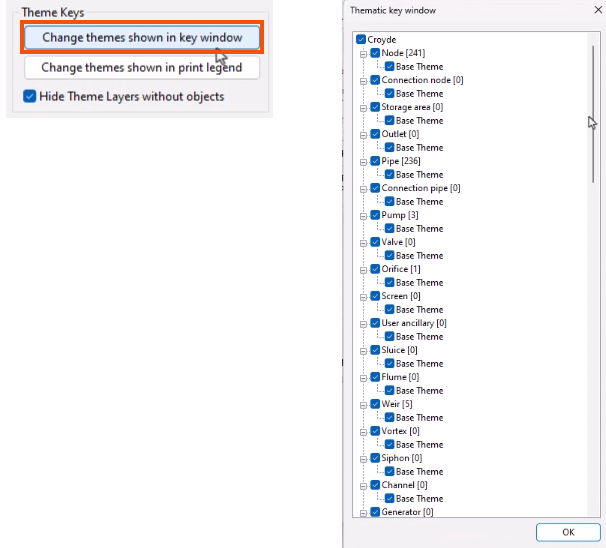
To fine tune theme visibility in the key window or in printouts:
- In the Theme Keys group, select Change themes shown in key window or Change themes shown in print legend.
- In the Thematic key window, select or deselect themes as needed.
- Click OK.
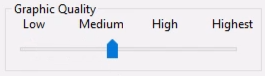
The Graphic Quality slider governs the switching between two different types of Microsoft Graphics Device Interface, GDI and GDI+, which are responsible for representing graphical objects and transmitting them to output devices, such as monitors and printers.
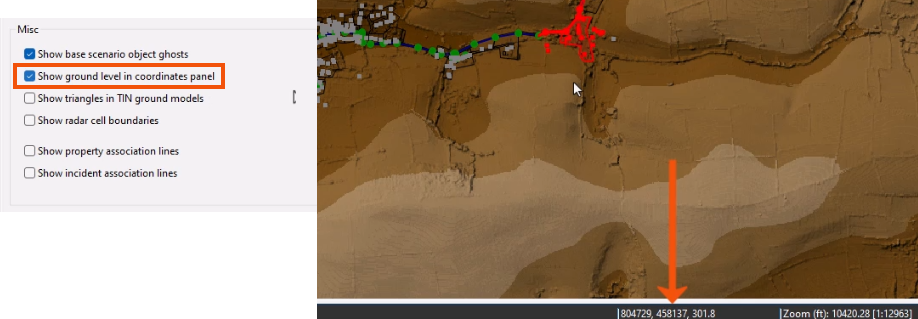
The Miscellaneous group includes additional settings to select or deselect, as needed.
- For example, when using a ground model, enable Show ground level in coordinates panel to display the ground level on the status bar.