Step-by-step guide
In IWLive Pro, once a pipe burst is identified and its impact visualized, you can create a response run to find a pipe isolation solution that minimizes the impact on the network and customers.
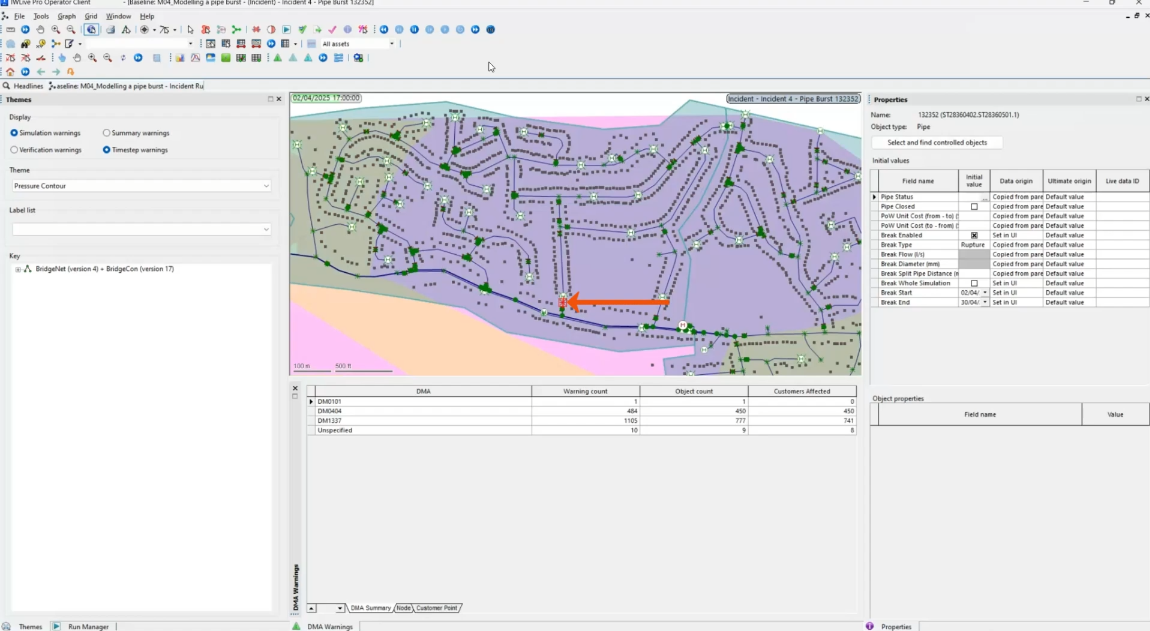
In this example, a suspected pipe burst was identified in DMA 1337 on April 2 after 5 PM. A series of burst incidents were created, and the location was narrowed to one of the offtakes, which is represented in Incident 4.
To configure a response run, first, create a child run of the incident.
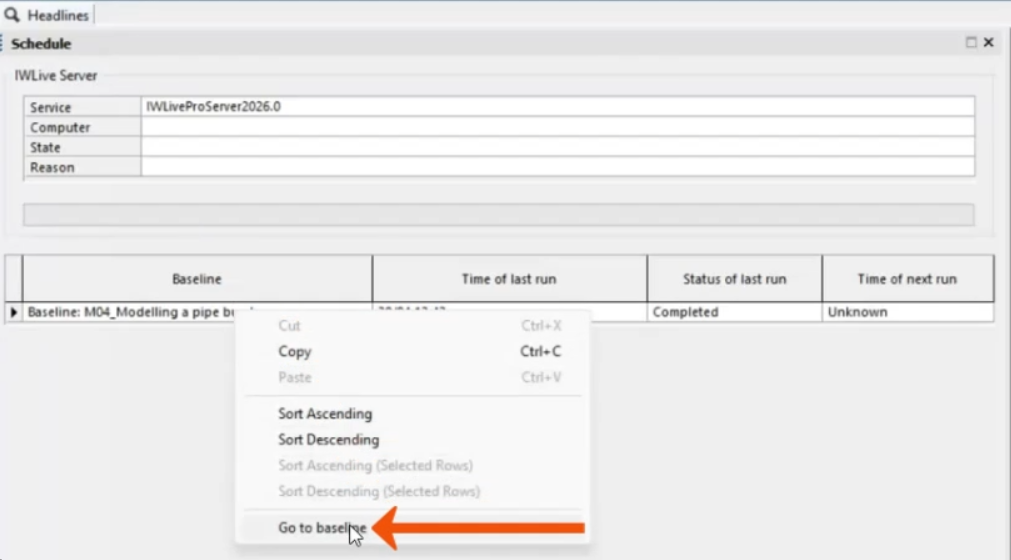
- On the Headlines page, Schedule tab, right-click the baseline and select Go to baseline.
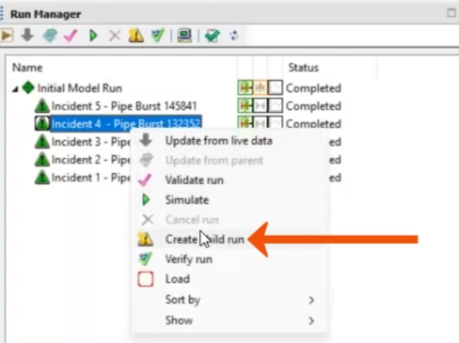
- In the Run Manager, expand Initial Model Run.
- Right-click Incident 4 and select Create child run.
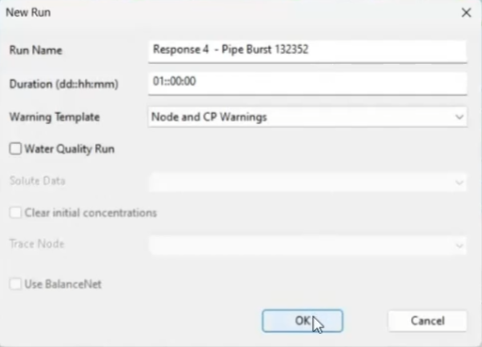
- In the New Run dialog, leave all options set to the defaults and click OK.
Next, create a pipe isolation.
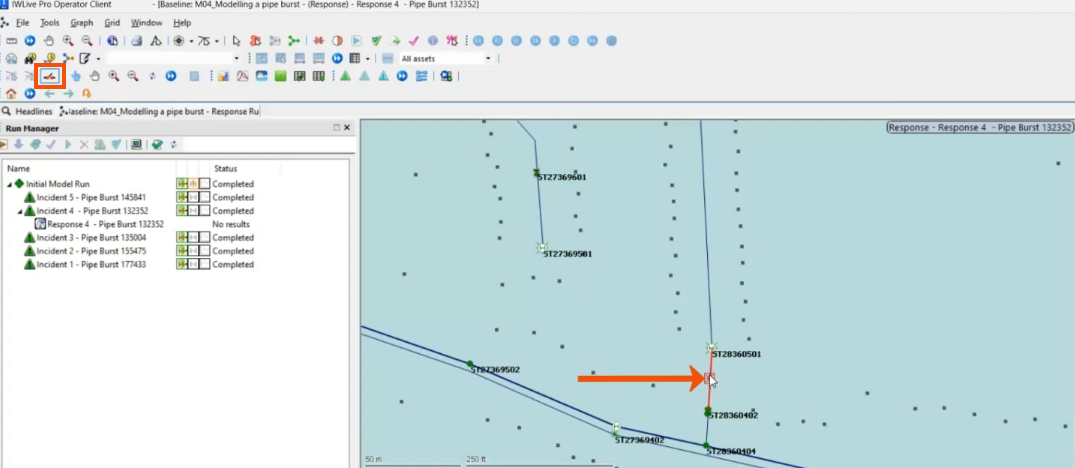
- In the GeoPlan, zoom to the pipe where the burst is configured.
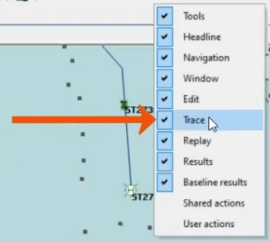
- If the Trace toolbar is not enabled, right-click the toolbar and select Trace.
- On the Trace toolbar, click Isolation Trace.
- In the GeoPlan, select the pipe.
To highlight the pipes that need to be isolated:
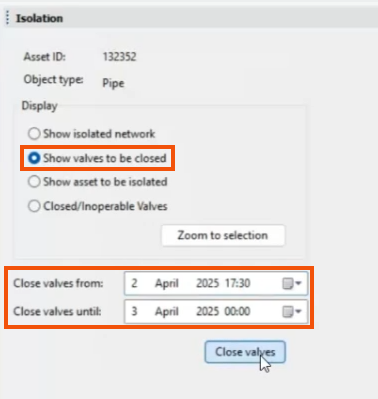
- In the Isolation window, select Show valves to be closed.
- In the Close valves from drop-down, set a time during the simulation for the valves to close, such as 5:30 PM on April 2.
- Set Close valves until to the following day, so the valves remain closed until the simulation is complete.
- Click Close valves.
- Click OK to close the notification that two valves have been closed.
To confirm that the valves have been shut:
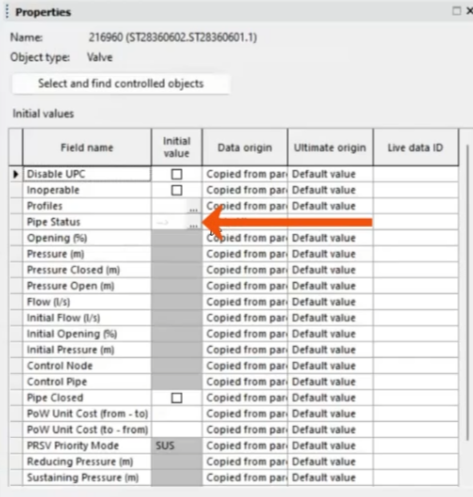
- In the GeoPlan, select one of the valves and open the Properties window.
- In the Initial values table, next to Pipe Status, click More (…).
- In the Editor, in the Pipe Closed column, verify the pipe status.
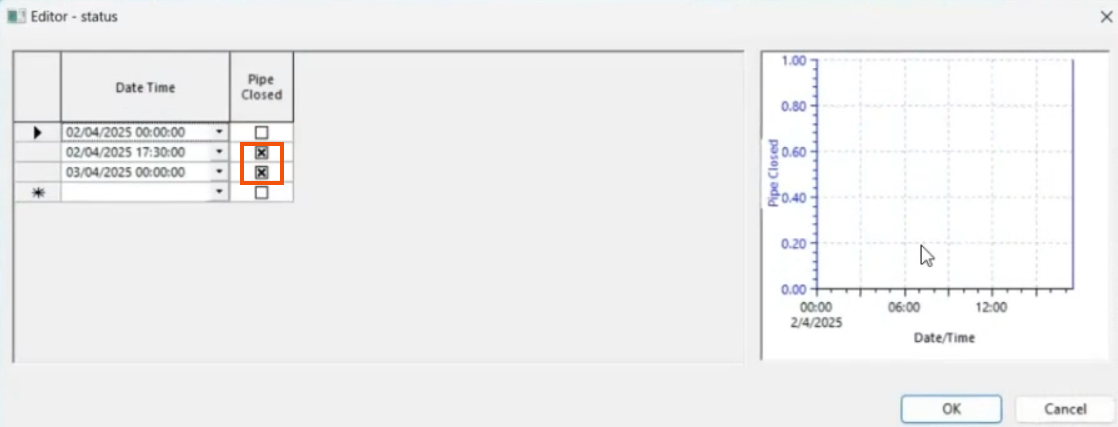
- Click OK.
- Repeat this process for the other valve.
Now, run the simulation.
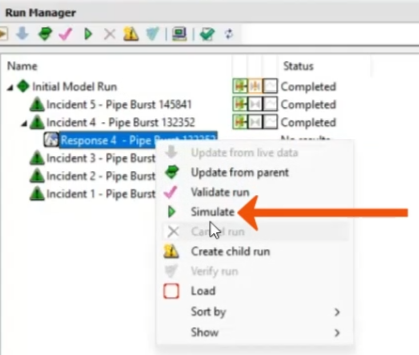
- From the Run Manager window, right-click the response run and select Simulate.
- In the Simulation License pop-up, click OK.
Once the simulation is complete, apply the Pressure Contour theme.
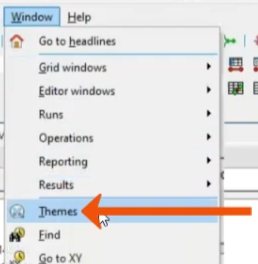
- Select Window > Themes.
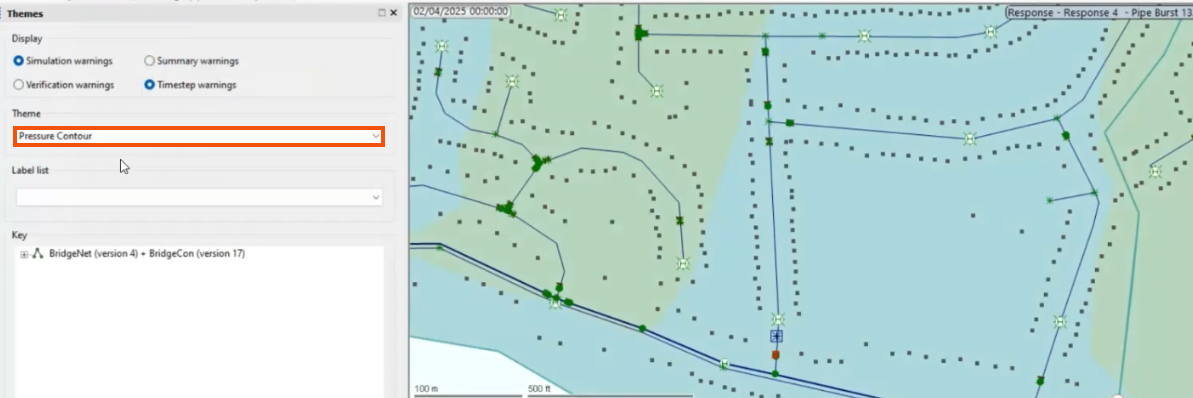
- In the Theme drop-down, select Pressure Contour.
- On the Replay toolbar, click Play.
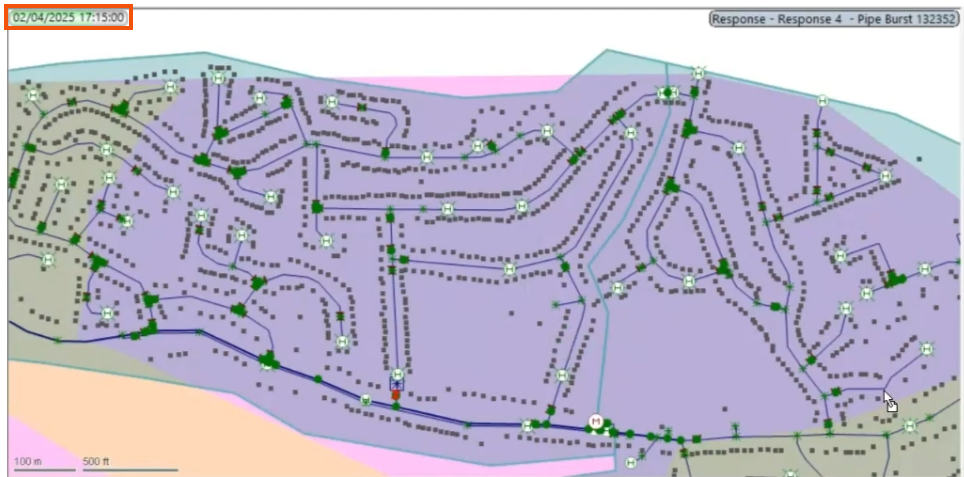
- Click Pause when the timeline is between 5 PM and 5:30 PM.
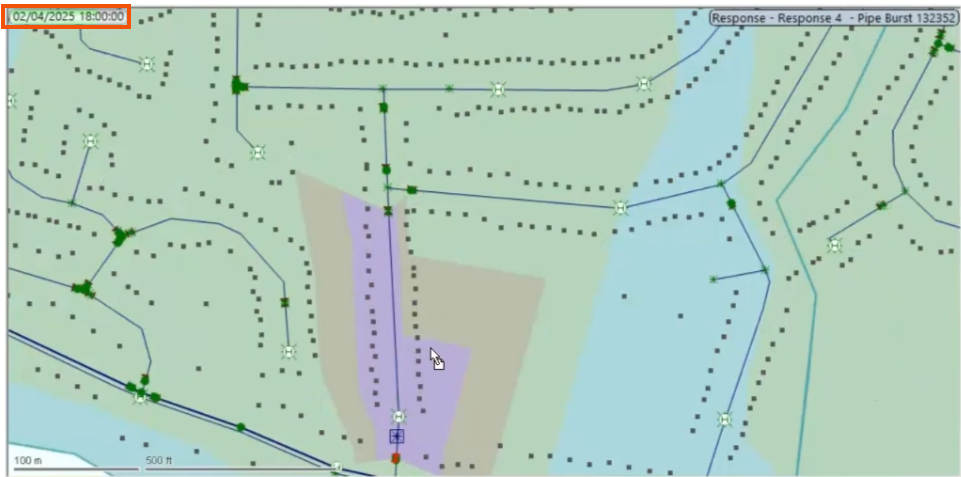
- Zoom out for a better view and notice that between 5 and 5:30 PM, the impact of the burst affects the entire area identified previously.
- Play the simulation again until the isolations are active.
- Click Pause.
The affected area in the network is reduced to only the small area shown, thereby minimizing the impact on both the network and the customers.