Step-by-step guide
When creating a new run in IWLive Pro, you can choose to run a water quality analysis. One of the uses for a water quality analysis is to calculate changes in the age of water over time throughout the network.
Start by creating a projection run.
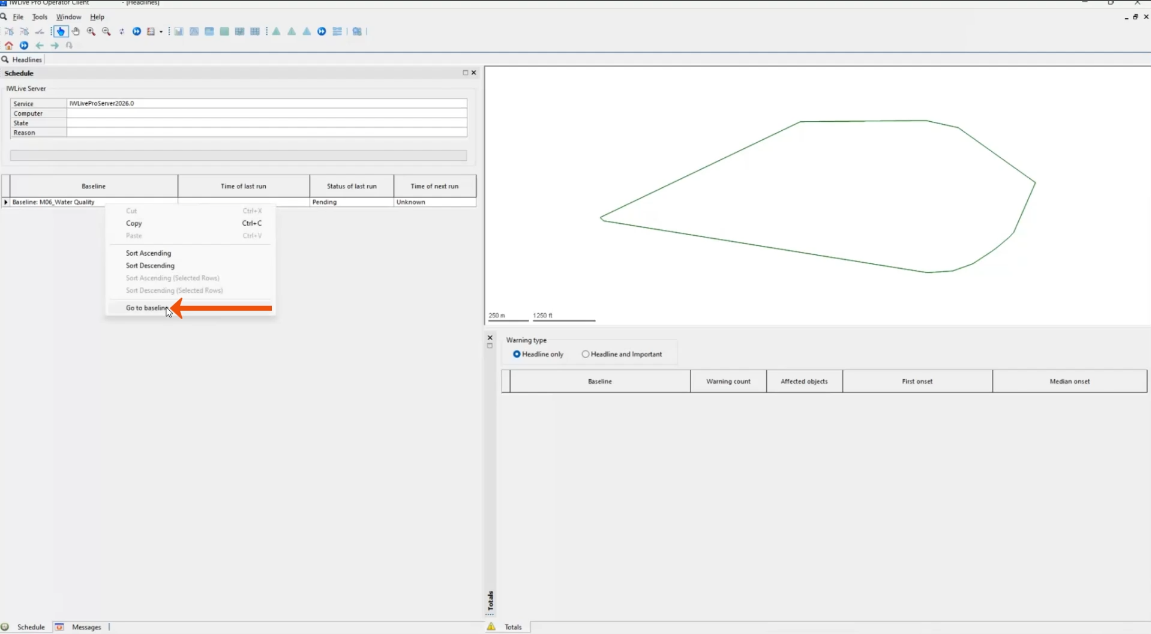
- In the Headlines tab, Schedule window, right-click the baseline and select Go to baseline.
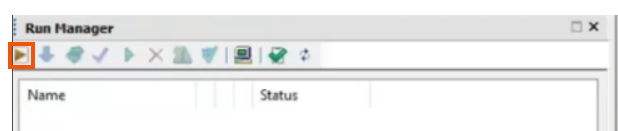
- In the Run Manager toolbar, click Request Projection Run.
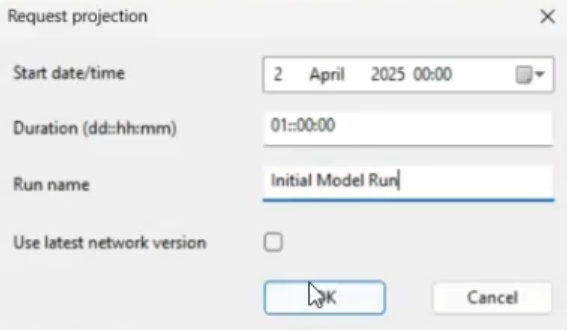
- In the Request projection dialog, set the start time to April 2 at midnight.
- Leave the Duration set to 1 day.
- Enter a Run name, such as “Initial Model Run”.
- Click OK.
Once the simulation is completed, create a new water quality incident.
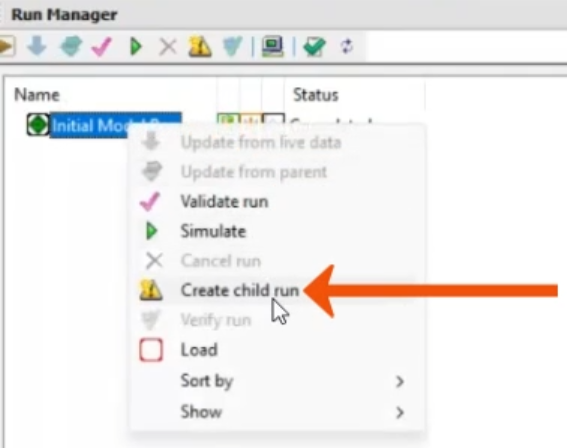
- From the Run Manager, right-click Initial Model Run and select Create child run.
- In the New Run dialog, enter a Run Name, such as “Incident Water Quality”.
- Set the Duration to 7 days.
- Set the Warning Template to Node Water Age Warnings.
- Enable Water Quality Run.
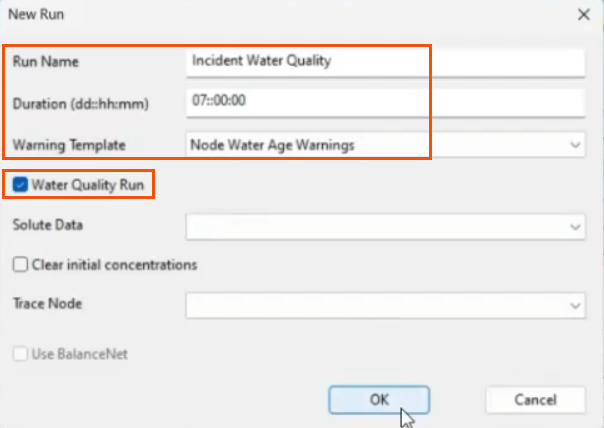
- Click OK.
At this point, you can make any changes to the network that are needed, but for this example, proceed with simulating the recent changes.
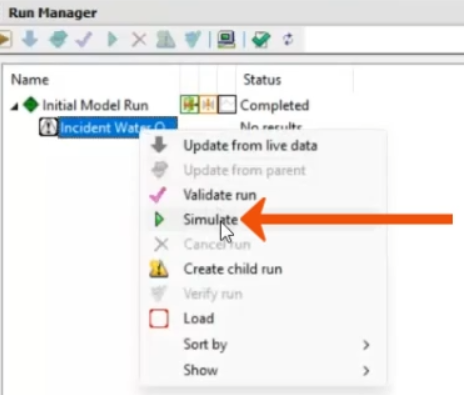
- In the Run Manager, right-click Incident Water Quality and select Simulate.
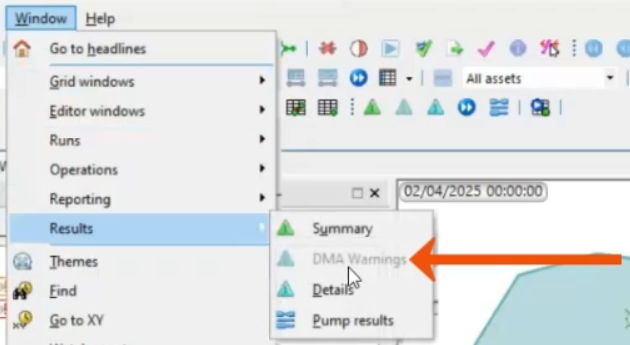
- Once the simulation is complete, if you do not see the DMA Warnings window, select Window > Results > DMA Warnings.
On the DMA Summary tab, a list of warnings includes the objects or nodes with a water age that is greater than 65 hours.
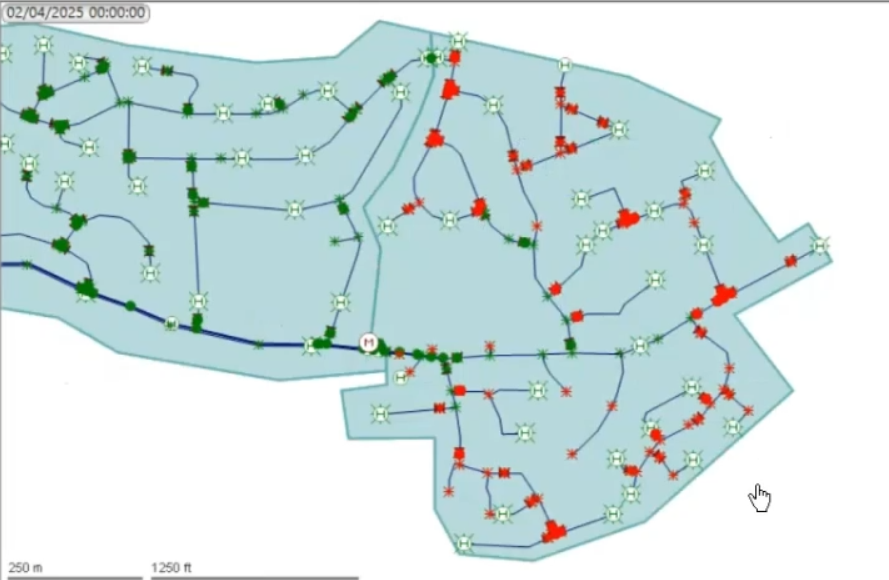
- To visualize the warnings for a particular DMA, such as DM0404, right-click the Object count and choose Select and find on map.
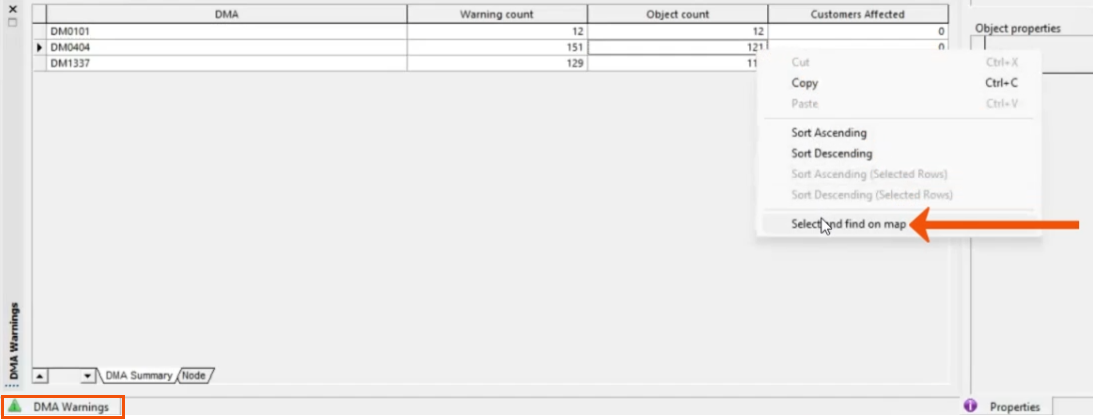
The map is updated to show the warnings.
Another way to visualize the results is to apply the Water Age Contour theme.
- From the Window menu, select Themes.
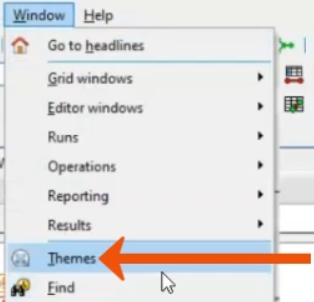
- In the Theme drop-down, select Water Age Contours.
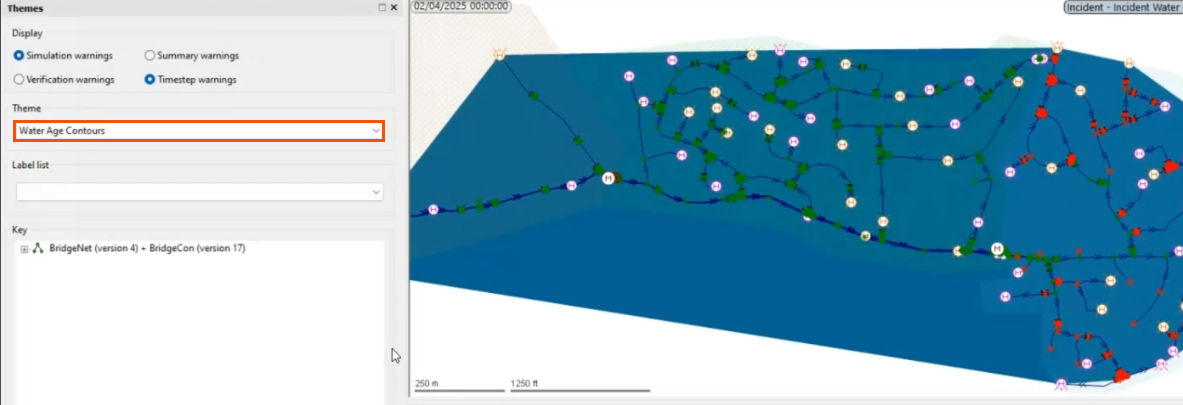
- On the Replay toolbar, click Play.

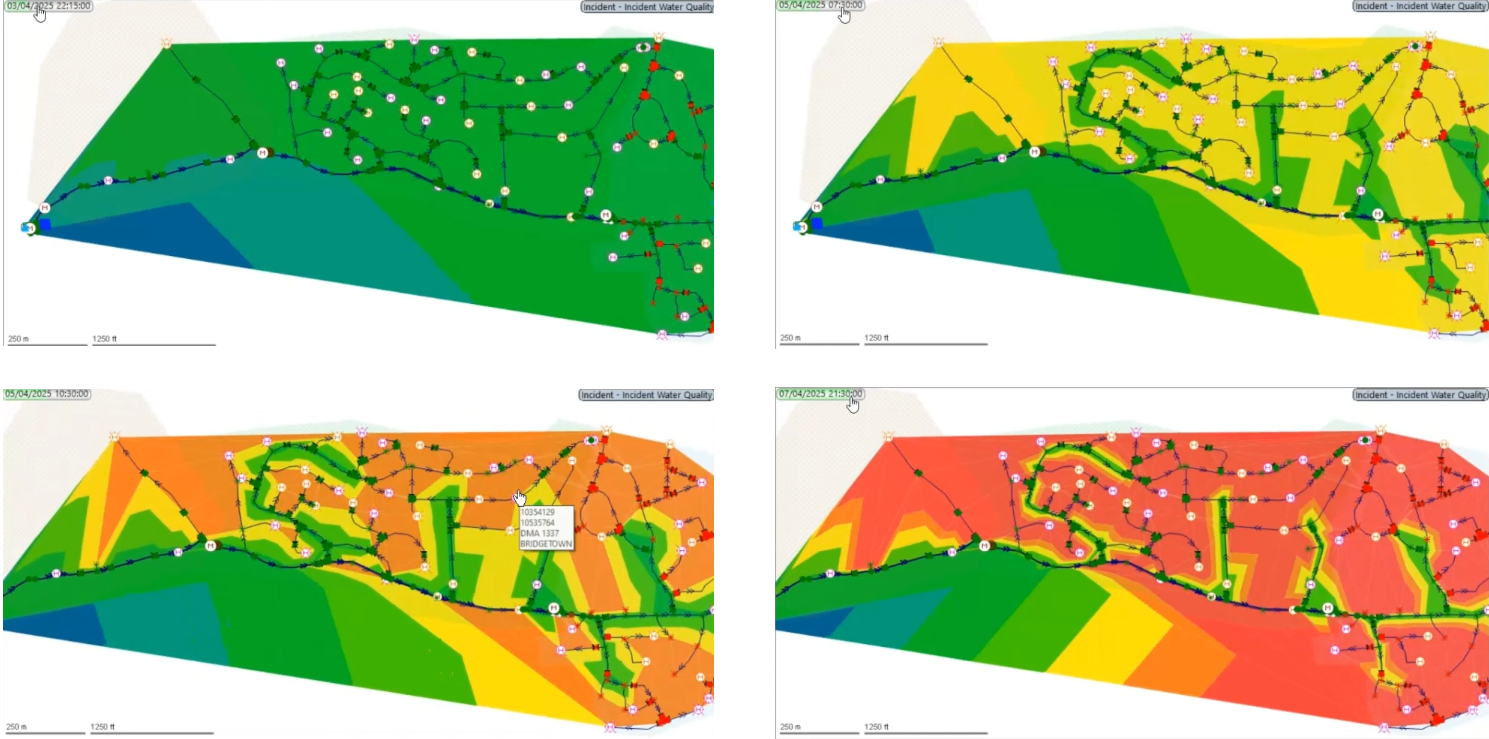
As the simulation progresses, observe the Water Age Contour map updating over time, as shown in these four snapshots. The top left image was taken first, followed by the top right, the bottom left, and the bottom right.
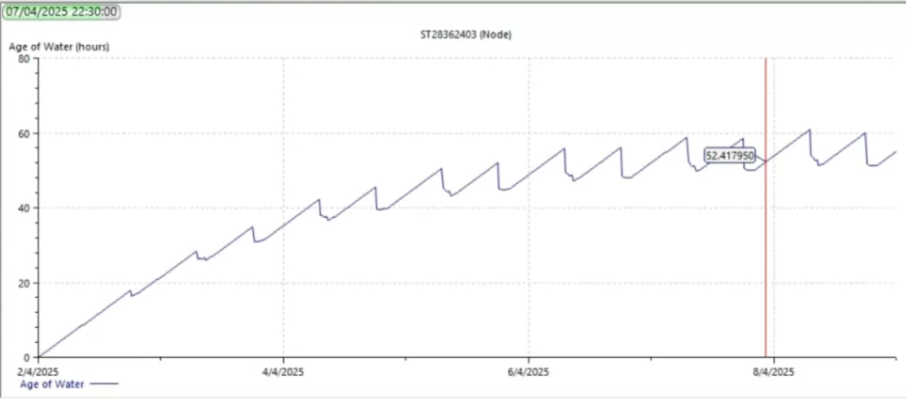
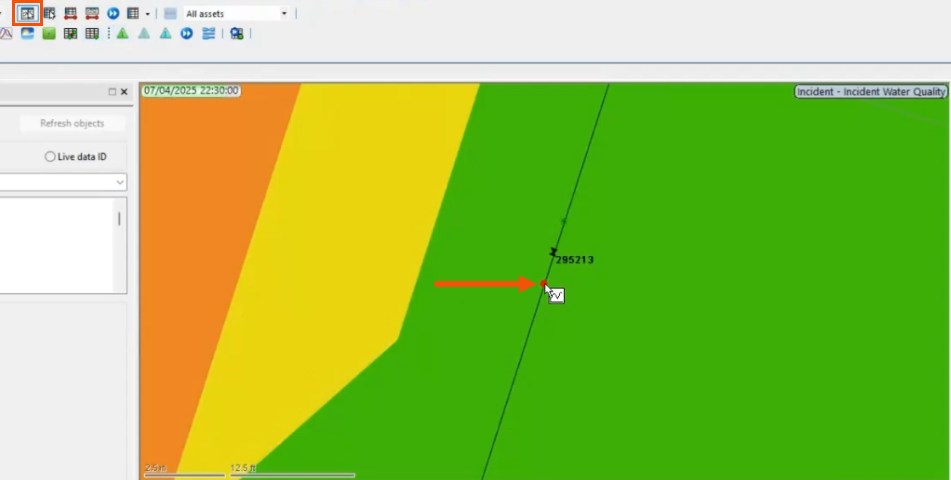
For further analysis, select and find a specific node on the GeoPlan and graph its results.
- On the Tools toolbar, click Graph.
- In the GeoPlan, select the node.
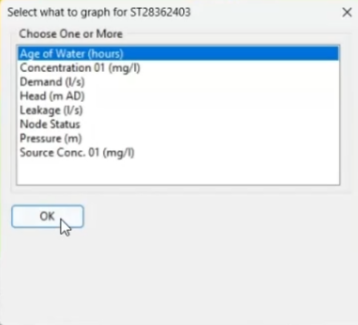
- In the Select what to graph for dialog, select Age of Water (hours).
- Click OK.
In this case, the graph shows the age of water increasing over time and stabilizing between 52 to 53 hours.