California Water Service (Cal Water) is the largest regulated American water utility west of the Mississippi River and the third largest publicly traded water utility in the country. Formed back in 1926, the San Jose-based company serves 499,400 customer connections that snake through 23 districts throughout the state.
But Cal Water is just one piece of a larger whole, a subsidiary of California Water Service Group, which also includes utilities in Washington, New Mexico, Texas, and Hawaii. Together, Group provides regulated and non-regulated utility services to more than 2.1 million people in 100 communities.
Investing in hydraulic modeling expertise
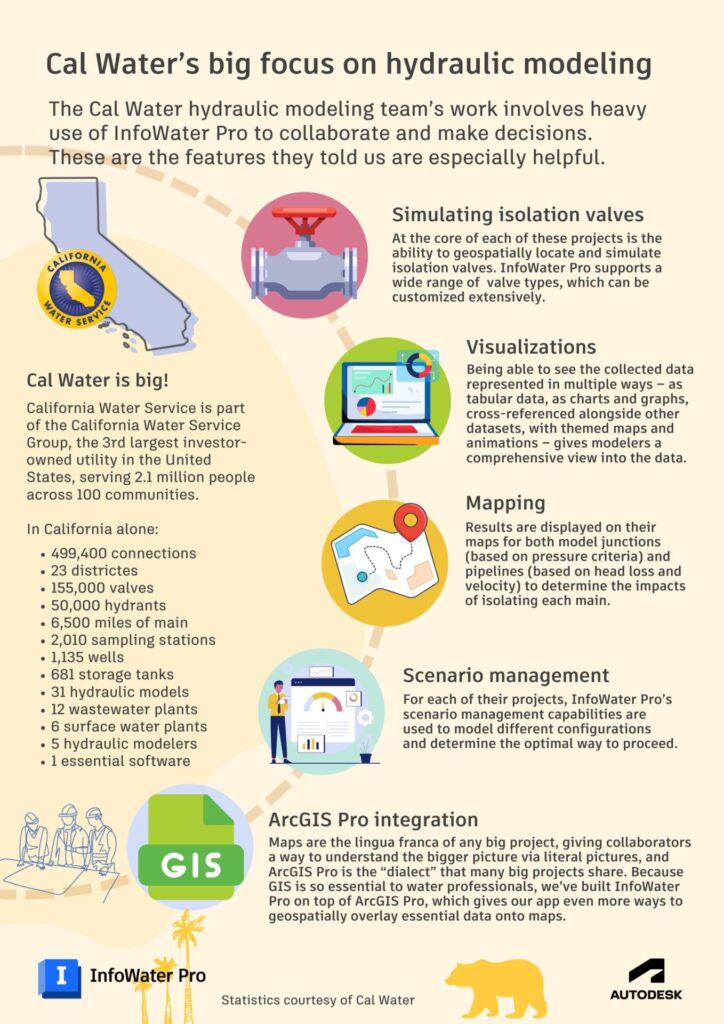
Running a network as large as Cal Water’s gets a lot easier when you invest in hydraulic modeling expertise, and they have a deep bench to draw from. They employ five modelers who maintain 31 different hydraulic models covering their extended water network. These five modelers have collectively built a solid process for analyzing water distribution systems across their entire network that they’re always prepared. They do it with InfoWater Pro and a set of smart workflows they’ve fine-tuned themselves that standardizes the way each of their modelers evaluates and analyzes their water networks.
Ultimately, their approach is two-pronged: They want to plan operationally for scheduled system shut-downs for upcoming construction projects, and they want to be able to respond as quickly as possible to any unexpected emergency system shut-downs.
The importance of pressure zones in their work
Cal Water modelers rely on pressure zones to analyze the effects of changes to their systems, and InfoWater Pro’s Pressure Zone Manager (PZM) is a tool that can be used to simplify and summarize the hydraulic information for individual pressure zones in a water distribution system model. Built atop ArcGIS Pro, InfoWater Pro’s PZM integrates advanced dynamic water network modeling with sophisticated graph-theoretical algorithms to help develop rigorous water distribution system models, accurately delineate pressure zone boundaries, and quickly generate comprehensive, color-coded pressure zone hydraulic schematics, including summaries of in/out flows through pumps, control valves, check valves, storage tanks, and reservoirs.
These pressure zones can provide a lot of flexibility for creating diagrammatic designs of both existing and proposed zones, allowing hydraulic modelers to quickly perform calculations and create multiple scenarios for all of the different valves and mains they control.
Case study #1: Isolating a leak at a railroad crossing in Livermore
A typical use case for pressure zones is confirming customers won’t be left without water due to a water main shut-down. Will hundreds – or even just a handful – of customers be affected by an upcoming construction project? Cal Water’s hydraulic modelers use pressure zones to experiment beforehand and find workarounds to ensure there won’t be a lot of phone calls from angry customers, without having to venture into the field.
This was the case in the run-up to an important water main project near a railroad crossing in Livermore. The main was leaking somewhere, and the desired outcome was to determine any connections that would be unavoidably isolated while the project was underway, potentially reconfiguring zones based on operational simplicity and optimal pressure for involved connections, which would allow them to maintain service for as many customers as possible during the work, including domestic pressure and fire flow.

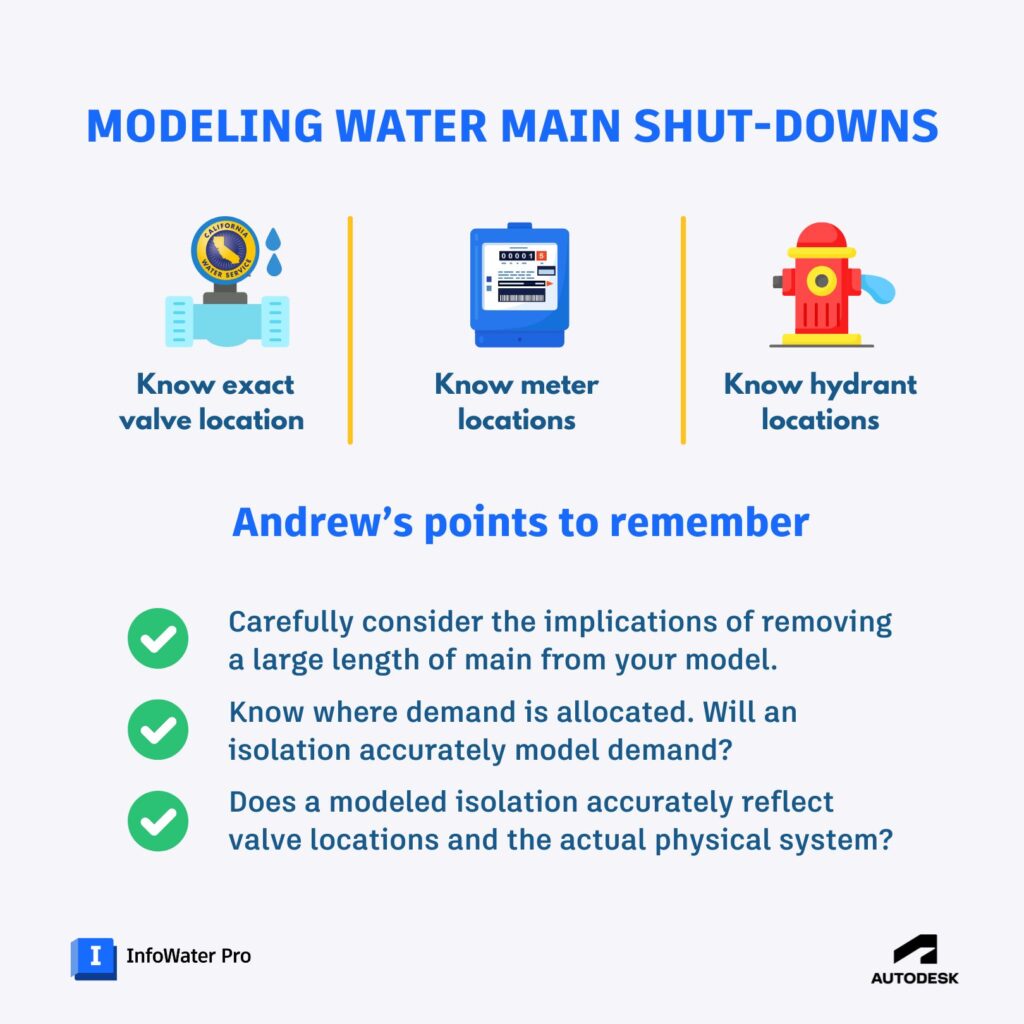
“If you’re only looking at your water distribution system from the perspective of a high-level master plan, it is easy to simply close a link in a general area and get a good estimate of the effects of closing a valve,” says Cal Water Hydraulic Modeling Engineer Andrew Boyle. “But in a situation like this, where we want to isolate a leak on a critical main near the intersection of four pressure-zone boundaries, we knew we needed to identify the exact location of isolation valves to properly model the isolated main. There are connections downstream that might get cut off if you close the valve, so you need to confirm that you’ve modeled it precisely in the model to avoid potentially giving bad advice.”
Collaborating with system operators, they were able to identify the exact location of isolation valves to properly model the isolated main. One detail that helped was InfoWater Pro’s ability to view background layers through GIS, which allowed them to cleverly add a billing meter data background layer to the model to verify their demand locations and view isolation valves by their actual point location, which is a more precise effort than modeling for simple master planning.
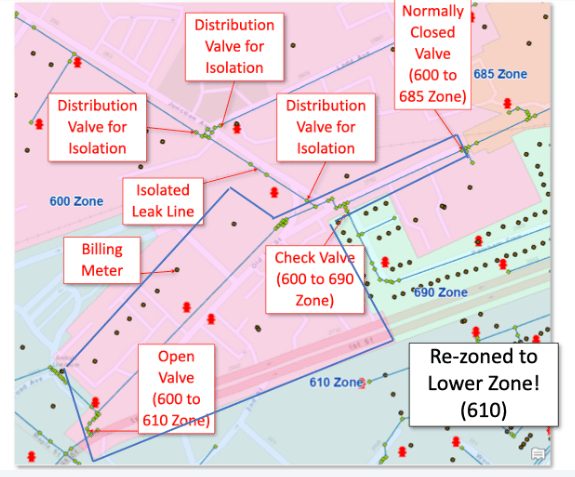
They discovered that the valve was not on the downstream side of a fire hydrant, as some had theorized, but on the other side of the hydrant, which meant taking the hydrant out of commission. One very happy outcome of this work was finding that the potentially affected customers were in adjacent pressure zones with similar elevation and pressures, which meant InfoWater Pro’s PZM could be used to reincorporate customer connections into different pressure zones for the entirety of the project.
Case study #2: A big, aging pipe springs a leak in Bakersfield
Another common use case for Cal Water modelers is dealing with the discovery of a leak on a large water main. For a project in Bakersfield, a road construction crew discovered a leak on a 24-inch water main, which had been flagged for potential retirement. The question became: Can it be repaired based on its existing age and condition, or is it better to fully replace it now? Or, to the crucial point of serving the fire department: “If we take it out of service,” asks Boyle, “will we still be able to maintain domestic service and emergency services?”
Without a precise hydraulic model, this involves a lot of guesswork that could lead to unexpected customer outages, but with their existing InfoWater Pro models, they were able to quickly justify the replacement, analyzing several scenarios using various segments of differing lengths of the isolated main to determine the full impact on the system.
“Performing a before and after comparison like this takes away the guesswork of having to test removal in the field, so you can have a clear view of what the system would look like both removed and replaced,” says Boyle. “In this case, we determined that it would be fine to remove it from service instead of taking the effort to repair it, which can actually be a cost savings in some situations.”
Case study #3: Building bigger and better roads in Visalia
A complex network of aging pipes lies underneath some of the old roads in the San Joaquin Valley, which requires very careful analysis, especially when you consider that this area’s water system is composed of Cal Water’s 63 wells, 4 storage tanks, and numerous booster pump stations. Removing a large water main in this situation requires more precision than a back-of-the-napkin estimate.
For a road rebuild project in Visalia, which was being modernized with a separated bicycle lane that would widen the road’s footprint, Cal Water immediately knew there was going to be a conflict with existing water pipes, and they needed to determine the impacts to the system during construction. They modeled several scenarios to determine impacts of domestic pressure, fire flow, and adjacent pipeline velocities and head-loss gradients with the main removed from service.
“In this kind of situation, where the line is in the right of way, we must decide whether or not to reroute the line as well, which could become a significant amount of costly work,” Boyle says. “Could we instead just take the line out of service? What are the implications of that decision to the greater water network?”
They used InfoWater Pro’s extended period simulation scenarios to create multiple contingency scenarios, each with different pump stations offline, to determine the impact on system resiliency by removing the main. “If you simply looked at this water network on a map, you might think removing the main would have huge effects, that you would be reducing redundancy,” says Boyle. “But because this is a very large well-based system, and because we can model it precisely across different pressure zones, we were able to advise the crew that they could simply close the main for the duration of the project with no negative effects to customers.”
Would the line ultimately need to be rebuilt? Perhaps, but they had all the information they needed in their model to make that decision later, data that was already viewable in ArcGIS by whoever was tasked with making the decision along the greater project lifecycle.
A comprehensive 250-page manual for hydraulic modeling
Cal Water maintains an extensive set of modeling standards, which they’ve developed around their use of InfoWater Pro. Since Cal Water owns and/or operates water systems in 23 districts, they worked hard to create a standard user experience, layout, and construction of each hydraulic model. These standards, in conjunction with several scripts and custom tools they also developed, allow their modelers to rapidly validate and update the physical infrastructure, demands, and control configurations in their models before moving forward with analysis.
They started compiling a manual when the modeling program was kicked-off at Cal Water six years ago, and it has grown into a 250-page-plus document. “With all the different systems we use and the necessity to respond to emergencies quickly, we wanted all the models to have a similar experience. Previously, they were all built by different people, by different external consultants, so they all looked and felt different. We also did a little bit of front-end work to set up the GIS Gateway, so now we’re all using the same ID numbers between our models and GIS databases.”
While not every process is automated, they have created excellent automated workflows that solve a lot of common collaboration problems. They’ve also found a good medium between automation and manual work – and manual work isn’t always a bad thing. They want their modelers to be hands on with the models and update them regularly, checking them consistently to confirm they’re precise. “Our goal is to update the physical structures in every model manually at least once per year,” Boyle says.
When you combine these processes with their extensive SCADA data historian, customer billing meter database data, robust GIS practices, and pressure monitoring and fire-flow testing databases, Cal Water has built a well-oiled hydraulic modeling machine that can deploy models for analyses on a very tight schedule. While these complex workflows are made more powerful by tapping into the many features of InfoWater Pro, ArcGIS, and scripting, it’s ultimately the supportive environment they’ve built and their professional dedication to hydraulic modeling that makes them stand out.
They’re organized, up-to-date, and ready to tackle any challenge.
What else do Autodesk customers do with InfoWater Pro?
- Did you know that Florida is one of the leaders of water reuse in the US? Learn how CHA Consulting uses InfoWater Pro to help Florida water utilities meet ambitious reclaimed water effluent regulations.
- Have you ever seen a leak-sniffing dog? It’s one of the many tools in Davidson Water’s toolbox, alongside InfoWater Pro. They are masters of both high-tech surge analysis and down-home community engagement.
- Hear from Arcadis Water Practice Lead Ben Chenevey in our customer video about how they’re advancing clean water management for water utilities with InfoWater Pro.