The latest update to InfoWorks WS Pro is here, with improvements to the platform to make hydraulic modelers’ lives easier. InfoWorks WS Pro 2024.5 introduces Diagnostic Tables to the platform so users can find stability issues within a given hydraulic model with more ease. Additionally, the Demand Area Analysis functionality already in the platform has been given many upgrades.
Along with these two improvements, let’s take a look at everything that upgrading to the latest version of InfoWorks WS Pro will bring you.
Model diagnostics
Finding and interpreting data in your model just got even better with the introduction of Diagnostic Tables. Diagnostic information for each simulation run’s log file is now available in easier to read and understand tables that better allow reviewing, sorting, mapping, and running queries.
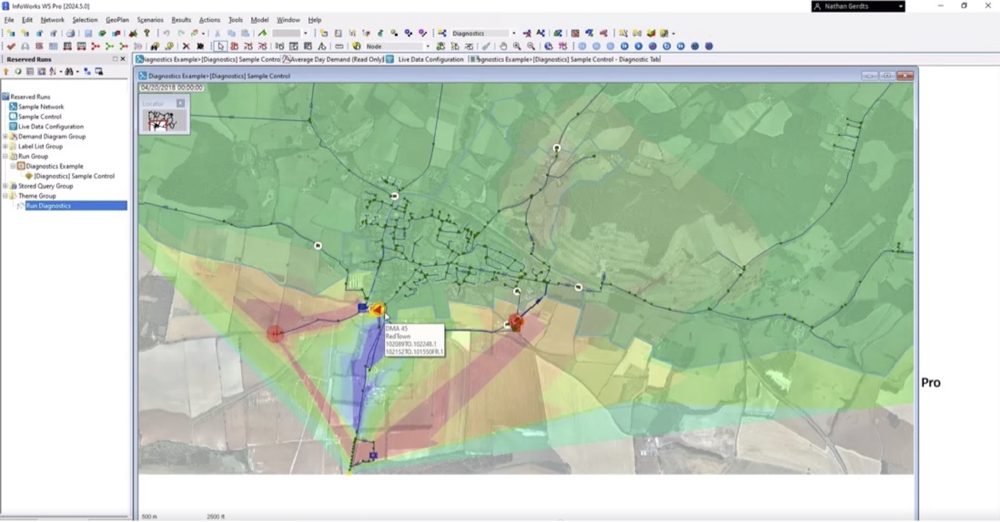
Known as Diagnostic Tables in the platform, they summarize stability, nodes with the greatest imbalance of flow, unstable or unreliable valves, pump and reservoir information, and suppressed demands. Each table can then be sorted and used to find objects in the GeoPlan, so you as the modeler can quickly understand spatial context and resolve and hydraulic issues with the model. A new built-in theme makes it easy to get started customizing maps to display and interpret spatial sources of instability.
To learn more about all of the ways Diagnostic Tables in InfoWorks WS Pro will help you manage data, you can read the help documentation for this release.
Demand Area Analysis
As you work to model demands within your hydraulic model, you now have the option to “scale existing demands” for the Demand Area Analysis function. This option preserves the relative weighting between the nodes in your network, scaling them up or down to match the calculated total for the given distribution area. You’ll likely find this useful when applying billed data to your model and when some customer points have higher demand than others.
We have also made the Leakage calculation in Demand Area Analysis optional to accommodate areas in your network where meter uncertainty is high compared to actual water demands.
Both of these improvements are oriented around providing modelers better optionality in their model so they can create even more accurate-to-reality digital twins of their network.
Water age and other improvements
The latest update allows water age to be inputted as a time-varying profile so that when you’re modeling separate networks in an interconnected system, your model will account for transfer of water between them.
We’ve also made improvements to the navigability of the Network menu, which has been consolidated into sub menus to simplify your navigation workflows. You’ll find that your need to scroll when accessing demands should be diminished, giving you incremental efficiency gains for your workflows.
Technical information hubs and product notes
Several other improvements to InfoWorks WS Pro were also made with this release, which you can read in our product release notes. You can dig into our Water Infrastructure roadmap to see our strategic vision in the short- and long-term horizons, which we update regularly. Finally, be sure to bookmark the InfoWorks WS Pro technical hub to serve as your one-stop-shop for every bit of technical content for the platform.