In the world of AEC, data is everywhere—but making it useful is another story. Most firms simply don’t have the time or resources to track things like sync behavior, model growth, version alignment, or change history across their projects. Even when this information exists, it’s scattered across Revit journals, ACC activity logs, spreadsheets, and ad‑hoc team updates. In raw form, it’s almost impossible to compare, interpret, or act upon.
This is where Autodesk Model Analytics (AMA) steps in. Model Analytics organizes key model‑health signals—metrics such as sync behavior, file size growth, version alignment, and change patterns—so they become meaningful indicators of performance. Now available in public beta as part of Autodesk Construction Cloud (ACC) Insights, Model Analytics automatically gathers and connects these signals—turning what used to be inaccessible or unusable data into a clear, actionable view of model performance.

But visibility alone isn’t the story. Model health has become one of the biggest hidden drivers of project risk, yet it’s rarely monitored in a systematic way. When model health slips—when file sizes surge, sync times climb, Revit versions drift, or uncontrolled changes accumulate—teams feel the impact immediately: slower coordination, frustrated users, unpredictable performance, and delays that ripple across disciplines. Poor model health forces teams into reactive firefighting instead of proactive planning, often costing hours or even days of lost momentum.
To help solve this problem, Model Analytics is focusing on model health. It’s not just a technical metric—it’s foundational to predictable delivery, efficient collaboration, and keeping fast‑moving project teams aligned. Model Analytics brings structure and automation to an area that has traditionally required manual inspection and tribal knowledge. By surfacing the signals that matter, Model Analytics empowers teams to catch issues earlier, understand why performance is shifting, and maintain healthier models from day one.
For years, project teams have struggled with poor model health, manual reviews, and the constant pressure to keep Revit models stable and aligned. One of the industry’s first real pushes toward solving this came from UNIFI, leaders in cloud‑based content management and model health tooling. When Autodesk acquired Project Analytics (PA), UNIFI’s model health technology, it became the foundation for Autodesk Model Analytics – a major step forward that gave firms a structured way to monitor model performance, track risk indicators, and understand how their Revit environments were behaving. PA provided powerful dashboards, but it still required manual setup and periodic updates, meaning teams often had to manage duplicate project directories and permission management in addition to where the projects were stored.
Autodesk Model Analytics builds directly on that foundation—not replacing the legacy, but evolving it. The vision has always been the same: give teams clearer visibility, earlier warnings, and less manual overhead. What’s different now is where and how that capability lives. By rebuilding PA’s core ideas natively inside Autodesk Construction Cloud (ACC), Model Analytics removes the friction of configuration and instantly connects to the cloud‑hosted models teams are already using. Every sync sends structured data directly into ACC Insights, allowing Model Analytics to deliver continuous, automatic model‑health telemetry without the extra steps. It’s the PA story taken to its next chapter: the same goals, the same principles, but finally integrated into the ecosystem where project teams spend their time.
Autodesk Model Analytics tracks the core signals that shape Revit model performance—things like sync times, file size growth, version alignment, model change patterns, and the overall frequency and impact of user activity. Each of these metrics tells a different part of the model‑health story: long sync times often reflect network strain or bloated models; increasing file sizes can reveal accumulated complexity; version misalignment creates instability and unexpected behavior; and the pattern of changes between syncs helps teams understand when, where, and why performance shifts occur. By automatically collecting and organizing these signals, Model Analytics gives teams a clear window into the causes behind slowdowns, crashes, and coordination friction. Instead of guessing why a model is lagging, teams can see the underlying indicators in near-real time—and act before issues impact delivery. Model Analytics isn’t just reporting data; it’s surfacing the operational heartbeat of your Revit models so teams can maintain predictable, stable performance throughout the life of a project.
Take a Closer Look
Let’s dig into how Model Analytics can help improve model health:
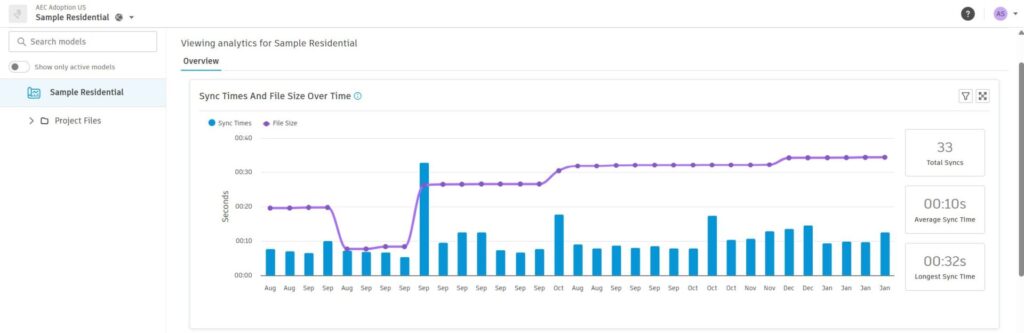
✅ Tracks model performance: Sync times and file sizes are monitored—providing clarity on what’s slowing teams down. Imagine being able to pinpoint exactly when and why model performance starts lagging, so issues can be addressed before they impact project delivery.
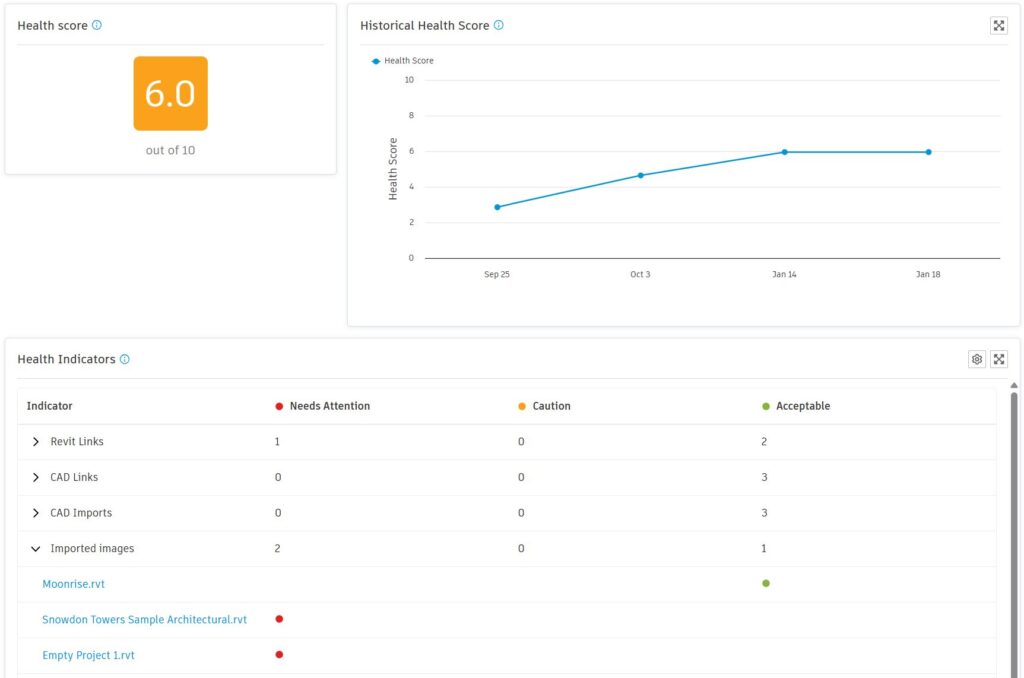
✅ Simplifies health scoring: Red-orange-green indicators make it easy to spot trouble and act fast. Model Analytics visual cues put critical information front and center, and health indicators give you details from your health score.
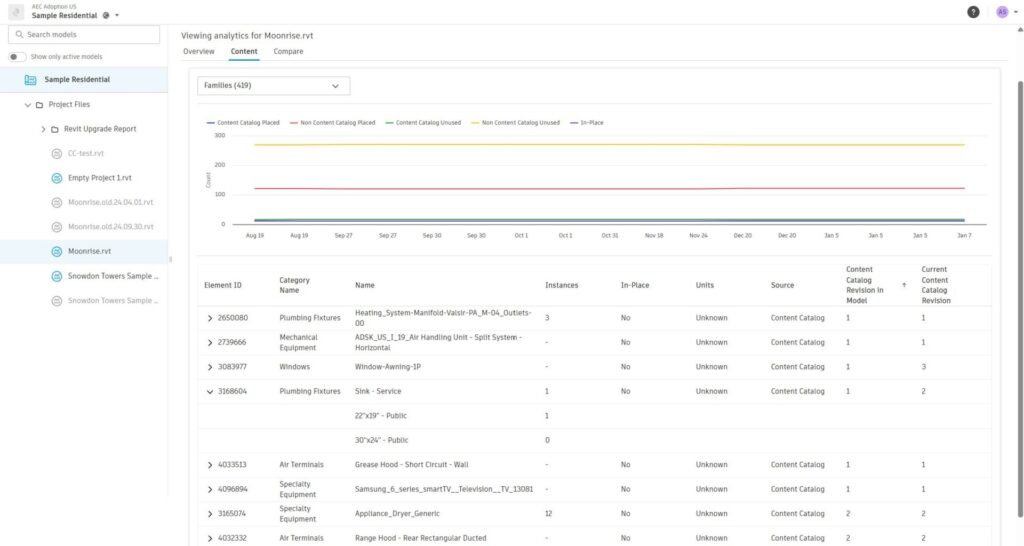
✅ View historical comparisons: See how models evolve over time and identify patterns that impact performance. This empowers teams to learn if the model has been bloated by unplaced content, in-place content, content that is out of date or from sources other than company approved Content Catalog.
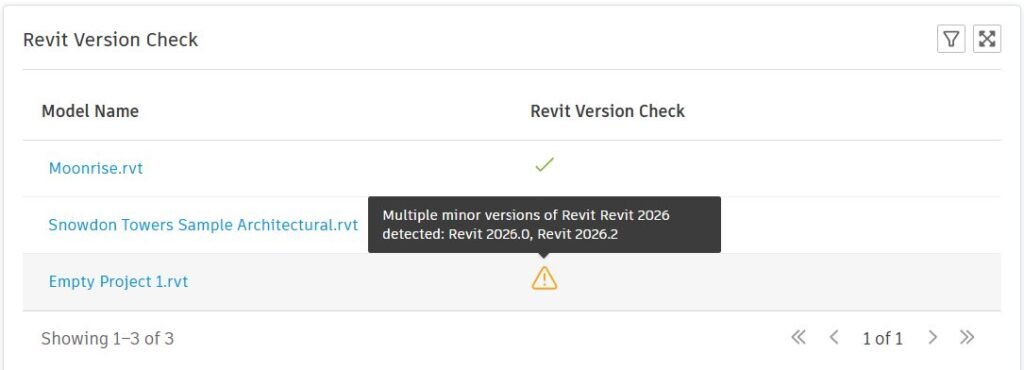
✅ Checks Revit versions: Keep everyone aligned and reduce version conflicts before they cause issues. Version management is often overlooked, and when it is, file corruption can cause the whole team to grind to a holt while the central model is being recovered likely along with loss of work.
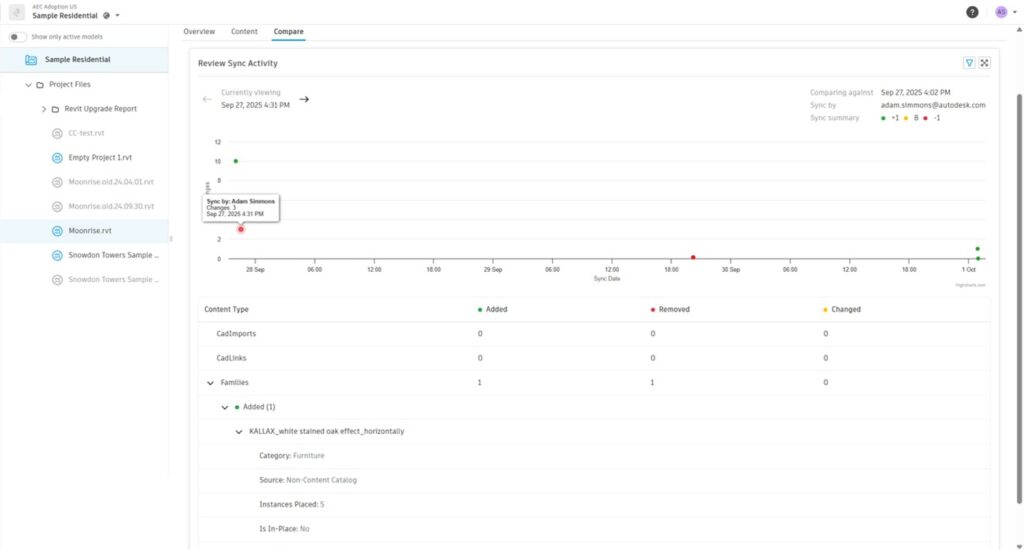
✅ Highlights model changes between syncs: Model Analytics surfaces what’s been added, removed, or modified—giving teams visibility into how models evolve. The timeline seen below, tracks each user sync, and the table below it will list details when a user sync is selected. The details display the item and information to understand what it is and clues for how it might be used in the project. This transparency supports better collaboration and accountability.
Connected Data, Smarter Decisions
Model Analytics is part of the AEC data model opening the door to future integrations with tools like Power BI, custom dashboards, and even AI-driven recommendations. That means your model health data isn’t siloed—it’s part of a broader ecosystem of model intelligence.
Customer feedback from the beta shows that teams want efficiency, accessibility, and proactive insights. Model Analytics is already delivering those needs, even in its early stages.
What does #BetterData mean for your project?
Better data means fewer surprises, faster decision-making, and more time spent on value-added work. It means being able to anticipate problems, rather than just react to them. For teams working in fast-paced environments, Model Analytics insights can be the difference between staying ahead or falling behind.
Ready to experience Model Analytics for yourself? Join the public beta and see how smarter model analytics and embedded insights can transform your workflows. Share your feedback, request new features, and explore model health telemetry with your existing workflows.